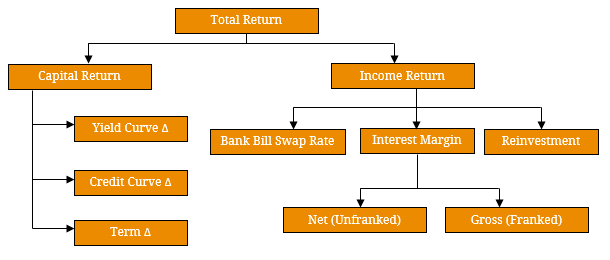
In the realm of financial markets, a key topic of interest for many investors is performance attribution. Specifically, this refers to the individual components that form a security, portfolio or market’s total return over a pre-set time period. Depending on the required granularity of one’s analysis, the components can be broken down into many factors which can then be utilised to formulate expectations of future performance. In its simplest form, the total return can be initially decomposed into an income return and capital return. However, further examination is largely dependent on the underlying security, portfolio or market being analysed given the return drivers will broadly differ across asset classes. In figure 1 below, we have constructed a basic attribution framework for an income security but acknowledge there a many other elements or approaches that could be included or used. Figure 1. Basic Income Security Attribution Framework  Source: BondAdviser By way of example, we can employ the above framework to attribute the performance of CBA PERLS VII (ASX Code: CBAPD) in 2017. This is the largest ($3 billion) and arguably most liquid listed hybrid security. This had a total franked return of 7.703% comprising (for a $100 security) capital appreciation of $2.820 and combined fully franked income of $4.551 over four quarterly payments during the year. On a relative opening gross price basis, this equates to an income and capital return of 2.947% and 4.756% respectively. If we delve into the income component, we can further separate the floating rate (90-day BBSW), margin and franking variables. In 2017, PERLS VII generated $1.751 of income from the 90-Day BBSW, $2.800 of fully franked income from its fixed interest rate margin (2.800%), which totaled to $4.551 (see table 1). Using this, we can solve for the franking component of the instrument’s franking income generation which was $1.365 during the year. In table 1, we illustrate these calculations and the relevant return attributions. Note that the BBSW return and gross margin return equate to the total gross (franked) income return and by subtracting the franking increment factor, we can derive the net return. Table 1. CBAPD Income Return Attribution
  Source: BondAdviser This demonstration has been conducted on a non-accumulation basis meaning coupons have not been reinvested into the security once paid over the period. This is a more realistic approach given units of the instrument are not divisible and rather any aggregate distributions are unlikely to reinvested into the security completely. However, assuming partial units can be bought we can include a reinvestment factor to our performance attribution which we calculate to be 0.217% (franked basis). As a result, the total accumulation return of CBAPD in 2017 would be 7.919%. Due to the compounding nature of this component, the reinvestment return increases through time (figure 2). Figure 2. CBAPD Cumulative Return Comparison Since Issuance
  Source: BondAdviser In comparison, the attribution of the capital return is a relatively more complex process:
- Although capital return attribution for this component can be split into changes in underlying interest rates (reference to Yield Curve Δ in figure 1), Additional Tier 1 (AT1) capital instruments are generally floating rate. This effectively means that capital value is relatively insensitive to rising or falling interest rate levels largely due to the fact that the distribution rate resets each period (quarterly in the case of CBAPD). The simplest process for estimating the return from interest rate changes is by using duration at the beginning of 2017 and the change in interest rates over the period (~21 bps). On this basis, only $0.034 of the capital return was attributable to lower interest rate leaving the bulk relating to changes in trading margins (Credit Curve Δ) and reductions in the term premium (Term Δ)
- We can apply the same process for the credit return component by applying credit duration to the change in CBAPD’s trading margin over 2017 (~53 bps) which results in a capital price uplift of $2.178.
- Lastly, CBAPD naturally moved down the yield curve over the course of 2017 as it moved closer to its first optional call date (December 2022). As a result, the expected term to call declined from 5.98 years to 4.98 years. Assuming no change in the underlying interest rates, this translates to a movement down the benchmark curve from 2.701% to 2.621%. Holding CBAPD’s trading margin constant, we can utilise AFMA pricing standards to calculate the change in capital price (excluding accrued interest) which we estimate to be $0.616.
Figure 3. CBAPD Underlying Swap Curve 2017 Shift  Source: AFMA, BondAdviser The summation of these components gives us a total price change of $2.837 versus the actual capital price change of $2.831 ($2.820 including changes in accrued interest). As a result, we have not explained $0.006 of the price change, which could be explained by changes in convexity, which refers to the change in curvature of the credit or benchmark curves. We do not adjust our calculations for this impact in the above analysis given the relatively flat term structure. With all our attribution framework now calculated, we can rank our return components to see what drove performance in 2017 for CBAPD. This is a useful exercise as a sense check on return expectations in the past and for the future. As figure 4 below illustrates, the fixed interest rate margin was the largest driver of the instrument’s return over the period (2.926%) which is what we would expect from an income-generating security. This was closely followed by trading margin compression – highlighting the strong performance of hybrid securities in 2017. Utilising this approach for all other AT1 hybrid securities across time, we can compare return periods to drive forward performance expectations. For these reasons, consistent and accurate performance attribution is a vital tool for investors. Figure 4. CBAPD Performance Attribution in 2017
  Source: BondAdviser