
Over the past decade, Netflix has risen to be a household name through its leading position in the of ~US$30 billion global video streaming market. The company is a constituent of the S&P500 index (the largest 500 stocks in the US) and its market capitalisation has grown significantly since 2012 as its international footprint has expanded to over 190 countries. Figure 1. Netflix Market Capitalisation 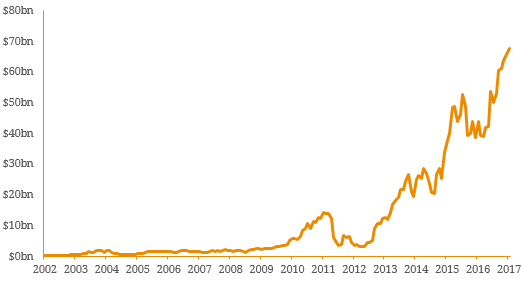 Source: Bloomberg Despite the company’s success, Netflix has one of the lowest credit ratings within the S&P500. Figure 2 illustrates the non-investment grade spectrum of the S&P500 and demonstrates the group’s relative credit quality against other large-cap US stocks. Note that average credit rating within the S&P500 is BBB+ and only 14.4% are rated non-investment grade by the credit rating agencies (excludes unrated constituents – 5% of S&P500) Figure 2. S&P500 Non-Investment Grade Companies by Market Capitalisation
  Source: Bloomberg This highlights that sheer company size does not necessarily translate to improvements in its credit profile. In fact, in the case of Netflix it is the exact opposite (Figure 3) where credit quality has declined as the group has grown over time. Figure. Netflix Historical Revenue and Credit Rating
  Source: Bloomberg On the surface, it appears the group’s rapid expansion has developed into its strong earnings profile but this has been at the expense of cash flow and the balance sheet. For the year ended 31 December 2016, the group recorded revenue of US$3.4 billion and EBITDA of US$437 million but cash from operations and free cash flow both deteriorated to new lows of -US$1.5 billion and -US$1.6 billion respectively. Meanwhile debt has grown from US$238 million in 2009 to US$3.4 billion in 2016 in order to fund the growth story and unsurprisingly credit metrics have deteriorated significantly. The growth of Netflix’s original video content is forecasted to weigh on free cash flow (expected to deplete $2 billion in cash this year) and management have openly stated it does not plan to return to positive cash flow for “many years”. Figure 4. Netflix Historical Cash Flow
  Source: Bloomberg Figure 5. Netflix Historical Total Debt and Credit Metrics
  Source: Bloomberg The group has been an active issuer in the US debt markets and recently sold US$1.4 billion of euro-denominated bonds in April 2017. Oddly, these bonds were issued with an investment-grade like covenant package with no limitations on debt incurrence or restricted payments warranting weak downside protection for investors. However, Netflix bonds do trade tighter to the broader US Corporate High-Yield Curve (Figure 6) implying an expectation that credit will improve as subscription growth continues its solid trajectory. The primary risk to this is the low switching costs inherent in the video streaming industry. Amazon, HBO and the BBC are also known for their own original content and hence competition for views is high. Figure 6. Netflix Relative Value Yield Curve
  Source: BondAdviser, Bloomberg While a key comfort for investors is Netflix’s ~US$65 billion equity cushion, the group’s progression nonetheless demonstrates growth at the expense of credit health. Given the capital-intensive nature and upfront fixed costs associated with content production, if management’s strategy is successful, earnings will benefit from inherent operating leverage resulting in strong margin improvement. As a result, the future success for the group from a credit perspective lies with management’s ambitions and their expertise behind the camera considering the company’s track record in original production is still relatively limited. Overall, the key takeaway for investors should be the notion that size does not always have a positive relationship with credit quality. Leveraged growth is a major red flag in credit analysis and this is reflective in Netflix’s current credit rating. For this reason, investment decisions should not be based upon a company’s income statement but rather the cash flow statement and balance sheet. This give investors a better indication of the underlying issuer’s ability to make scheduled interest payments and importantly, repayment of principle at maturity.
An employee-owned financial services provider focused on the Debt Capital Markets.
© Bond Adviser Pty Ltd ‧ ASFL 456783 ‧ ABN 31 164 148 467 ‧ Important Information
This site is protected by reCAPTCHA and the Google Privacy Policy and Terms of Service apply.
© Bond Adviser Pty Ltd ‧ ASFL 456783
ABN 31 164 148 467 ‧ Important Information
This site is protected by reCAPTCHA and the Google Privacy Policy and Terms of Service apply.