
As investors return from the holiday season they will be keen to understand what has happened in financial markets over the past few weeks to cause a ~380 point decrease (~7.1% drop from 30 December 2015 to today) in the ASX200. On the other hand the Bloomberg AUSBond Composite Index is broadly flat over the same period. While we acknowledge the performance of the composite bond index is predominanltly driven by treasuries and not reflective of clients exposure to credit it does give the investor a sense of how sensitive equities markets are to problems with broad market issues.
Given most users are now back at work we thought it appropriate to review what worked and what didn’t in 2015. The AusBond Composite Bond Index marginally outperformed the ASX 200 Index (accumulation) for the year with the indices providing a total return of 2.59% and 2.56% respectively. The outperformance was despite a strong performance by equities in the final quarter (albeit this has been completely wiped out in the first week of 2016). The standout income strategy of the year was to remain defensive in credit (i.e higher up the capital structure) and relatively short (< 2 years) duration. Fixed rate bonds performed well in the first half of the year as yields declined across the globe but this all but evaporated in the second half as concerns that inflation would increase as a result of low oil prices. The Australian 10Y Government Bond (click here) returned just over 4% for the year which is far better than cash and equities but was below the long-run expectation of 6.0-6.5%. Overall, the performance of all domestic asset classes (i.e absolute return) in calendar 2015 was below long run averages. The best of a bad bunch in Australia was floating rate credit (this excludes hybrid or capital securities) which returned 3.02%.
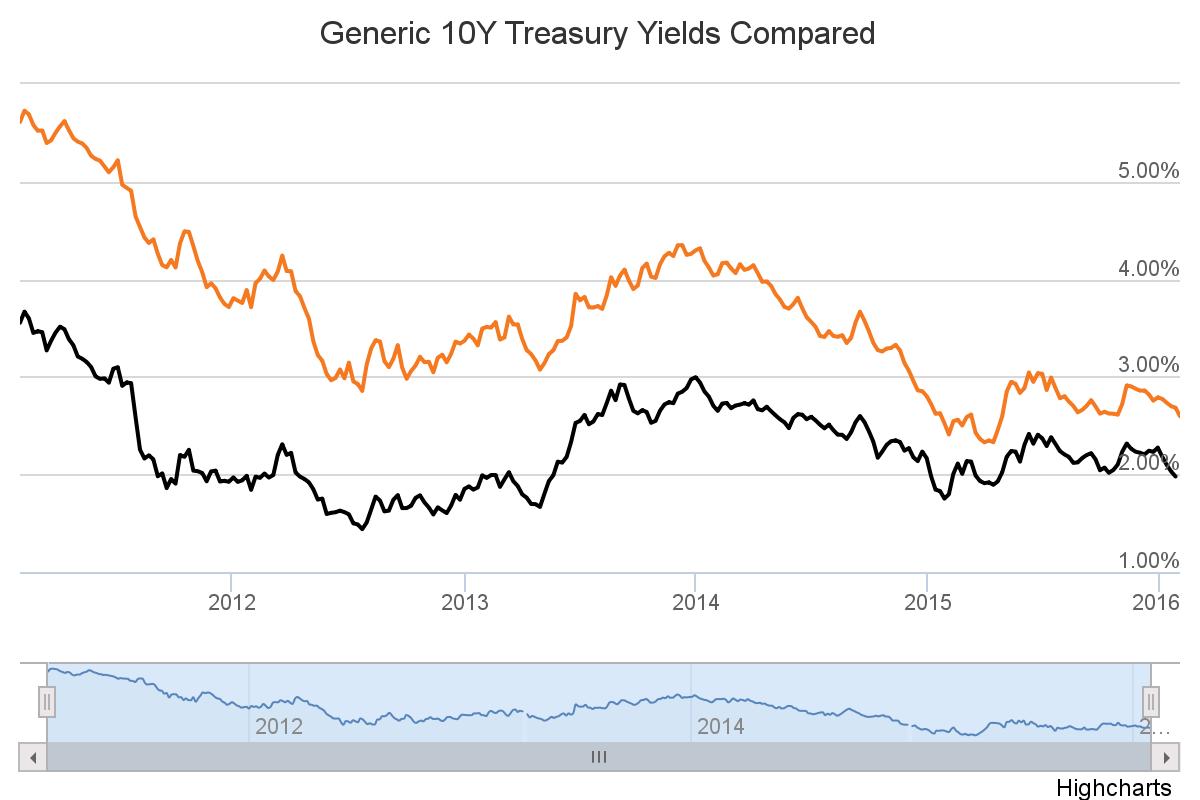
Click below for Interactive Charts Chart 1: Bloomberg AUSBond Composite Index (Monthly) Chart 2: Bonds vs Equities 2014/15 (Monthly)
Listed debt and hybrid securities (excluding government bonds) had varied performances in 2015 but overall sub-par with the Evans and Partners All ASX Listed Bond and Hybrid Index returning 0.03% for 2015. As the majority of market capitalisation (excluding Government Bonds) is Tier 1 Bank Capital Securities, the index was unduly unfluenced by a repricing of risk for all bank securities. The underperformance of bank hybrids was met with negative publicity and in turn negative investor sentiment . Our thesis on bank hybrids remains unchanged. The risk is ultimately in believing managements’ ability to maintain an adequate capital buffer (Capital Conservation Buffer (CCB) dictates that dividend/interest payments on hybrids and equities will not be allowed if the minimim is breached). APRA has a proven record of managing the banks conservatively and we see no reason why this would change in the short term.
On an individual security basis the worst performing securities were PERLV VII (-6.0%), Westpac Capital Notes II (-6.5%), Crown Subordinated Notes I & II (-8.6% and -9.9% respectively) and Perpetual Securities (i.e Multiplex SITES, National Income Securities, Macquarie Income Securities, TELYS4). On the flip side the best performing listed interest rate securities were Nufarm NSS (+8.1%), Heritage Retail Bonds (+5.9%), APA Subordinated Notes (+5.4%) and AGL Subordinated Notes (+5.0%).
Interest Rates
In economic news the standout release over the past few weeks has been the Commodity Index (71.2) down 23.3% year on year. This Thursday employment figures for December 2015 are due to be released with the expectation of -10K vs +71K in November. The November figure is the best monthly gain in 15 years so a drop from this level is to be expected (there may be a downward revision to the November figures). Our opinion is the RBA is gaining confidence that the economy is transitioning away from mining and provided growth in employment is maintained the probability of further rate cuts is low (even if inflation is below target). The only downside risk to this thesis are further shocks in financial markets requiring the RBA to intervene.
In February, the 10-year bond yield hit an all-time low of 2.27% before lifting to highs near 3.15% on June 11. In early November 2015 there was a progressive increase in yield from ~2.60% to a high of 2.99%. However, since mid December the flight to quality has meant the 10Y yield has dropped to 2.71%. The 3-year bond has followed a similar pattern and broke out of its recent yield range (1.90 – 2.1%) in November/December 2015 reaching a high of 2.18% on 7 December 2015. On 8 January 2016, the ASX 30 Day Interbank Cash Rate Futures February 2016 contract was trading at 98.04 indicating a 17% expectation of an interest rate decrease to 1.75% at the next RBA Board meeting.


 Interactive Charts Below