Consumer Credit Default rates in the US rose only slightly in December according to the S&P Experian Consumer Credit Default Indices released last week. The comprehensive composite index, which measures consumer default across a range of loan types, stood at 0.89% up 2.3% from the previous month but down 8% since December 2015. The managing director of the Index Committee at S&P Dow Jones Indices elaborated on the indices stating that “National average consumer credit default rates continue at low levels in an improving economy.” The index, which measures the proportion of consumer credit accounts that go into default for the first time each month, measures default rates in four loan types:
- Auto Loans – all auto loans and leases
- Bankcards – revolving cards issued by banks (excludes private label or retail cards)
- First Mortgages – first home mortgages
- Second Mortgages – closed end second mortgages and home equity loans (excludes Home Equity Lines of Credit)
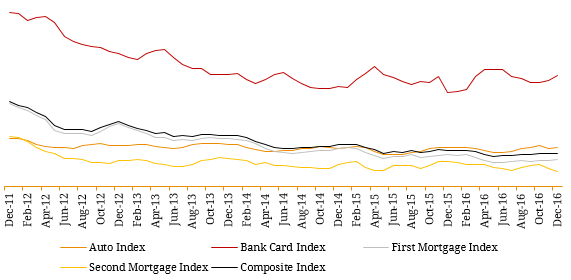
A weighted average of these headline indices is reflected by the Composite Index. Figure 1. Consumer Credit Default Index (2011-16)  Source: S&P Dow Jones, Experian In a segment breakdown, the bank card default rate showed greatest increase (0.14%) standing at 2.95% in December. Bank card sector defaults ticked up slightly in the last two months, reversing five months of flat to down performance. This may reflect rising retail defaults since the spring and larger consumer credit extensions in October and November. Meanwhile, auto loan rates increased 0.03% to 1.03% – this was attributed to the rise in auto and light truck sales up since August, and default rates held steady. On the home loan front, mortgage default patters stayed stable with first mortgage rates up 0.03% to 0.71% while the second mortgage rate declined 0.07% from November to 0.41% in December. Geographically, of the five cities covered, Miami experienced the largest increase, by 0.09% to 1.53% in December and is at a 30-month high. This is cause of worry as Miami home prices (October 2016) were 22% below their December 2006 peak, while nationally, home prices have recently surpassed the pre-crisis peak set in July 2006. Florida also lags national trends in other measures – it is among the five states with the most foreclosures in 2016. Meanwhile, the rate in Chicago and LA increased 0.02% to 0.98% and 0.72% respective while Dallas reported an increase of 0.01% to 0.72%. New York was the only city to experience a decline of 0.04% to 0.87%. Figure 2: Miami vs National First Mortgage Default Indices
  Source: S&P Dow Jones & Experian While affirming the current credit strength of the economy, the recent data cautioned that favourable default trends would be tested with the projected rise in interest rates by the US Federal Reserve (translating to higher borrowing costs) in 2017. This recent surge in inflation expectations and improving economic outlook which has led to an upward revision in forecasted rate hikes by the Federal Reserve in 2017. While this increase is already being priced into US mortgage products, the economy is still in a very low yield environment historically speaking (Figure 3) and as a result, we expect default rates to remain steady in the US. Figure 3. US 30-Year Fixed Rate Mortgage Rate
  Source: Freddie Mac