In our 2017 outlook, we stated our preference for direct securities over index strategies and that a higher yield curve would make it difficult for passive ‘long only’ strategies to outperform. This was the case in 2016 as many indices underperformed as long term interest rates rose on higher inflationary expectations. Table 1. Major Fixed Income Indices Returns
| Index | 1 Month | 3 Month | 6 Month | 1 Year | 2017 YTD | 2016 |
| Barclays Global Aggregate Index | -0.21% | 1.41% | -6.28% | -1.67% | -0.03% | 2.09% |
| Bloomberg AusBond Composite Index | -0.22% | 0.51% | -1.82% | 1.87% | 0.12% | 2.92% |
| Bloomberg AusBond Credit Index | 0.20% | 1.03% | 0.09% | 3.85% | 0.87% | 3.79% |
| Bloomberg AusBond Treasury Index | -0.41% | 1.41% | -6.28% | -1.67% | -0.03% | 2.51% |
| S&P/ASX Fixed Interest Index | -0.30% | 0.48% | -2.18% | 1.24% | 0.05% | 2.55% |
Source: Bloomberg as at 15th of March 2017. Many institutional (i.e. superannuation) mandates require a proportion of funds to be invested in fixed rate government bonds of longer duration. Additionally, exchange-traded funds (ETFs) that track Australian fixed income indices (i.e. AusBond index is ~70% weighted to government or state government securities) have also underperformed. Arguably similar returns could have been achieved with term deposit products with certainty of income and maturity date. Given the new rising interest rate environment, we expect this trend to continue and hence, active investing should be a priority for 2017. This involves selecting individual securities in a broader portfolio context to achieve superior returns. By no means does this mean to completely disregard passive ETFs but rather, investors should actively allocate capital to different tracked-indices (and direct securities) subject to a clear and concise investment thesis.
By way of example, here are some of our past recommendations on high-beta securities to demonstrate the value of active security selection. Figure 1. Crown Subordinated Notes I & II Trading Margins (ASX: CWNHA, CWNHB)  Source: BondAdviser Figure 2. Challenger Capital Notes Trading Margin (ASX: CGFPA)
  Source: BondAdviser Figure 3. Origin Energy Subordinated Notes Trading Margin (Called Dec 2016)
  Source: BondAdviser
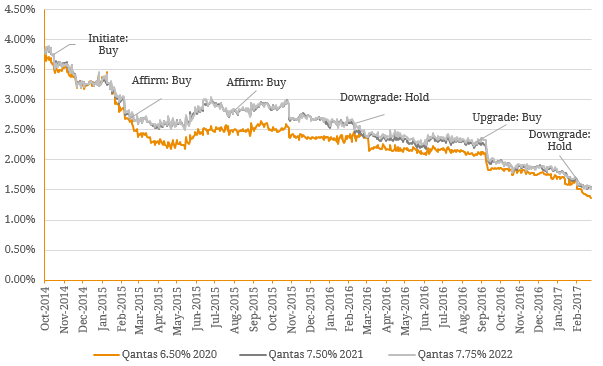
These securities are obviously higher risk to those included in the major fixed income indices and hence have higher returns. However, we believe it is important to show these examples as the bulk of fixed income index securities are wholesale and hence, off limits to retail investors. Nonetheless, for a more comparable illustration we depict some of our active recommendations for these over-the-counter (OTC) securities. Retail investors should note these corporate OTC securities are available in the form of exchange-traded products known as Exchange-Traded Bonds (XTBs). Figure 4. Qantas Senior Bond Trading Margins  Source: BondAdviser Figure 5. Woolworths Senior Bond Trading Margin (coupon of 6.00% maturing in 2019)
  Source: BondAdviser
While individual direct security selection is important to generate alpha (i.e. outperformance of the market), this strategy should fit within a well-diversified active portfolio. Given the composition of the retail fixed income market, we encourage and utilise (for the BondAdviser model portfolios) a core-satellite approach when conducting portfolio management. Under this investment strategy, the major banks and other financial issuers constitute the core and corporate issuers/other high-yield securities comprise the satellite component. The satellite portfolio of the portfolio is the main distinction from passive fixed income market indices as it is the source of outperformance over time (Table 2). Figure 6. BondAdviser Model Portfolio Composition  Source: Hub24 as at 22nd of March 2017. The BondAdviser Income Opportunities Portfolio aims to outperform the RBA Cash Rate by 3.0% over the medium term (before fees). The objective of the portfolio is to provide income with an investment strategy focused on a diversified, high conviction set of investments with either stable or improving credit outlooks. Although this is not a cash portfolio the focus is on assets which are readily transparent in terms of price and liquidity. This portfolio is typically used as a defensive investment and therefore capital preservation is equally important as steady, dependable income streams. On the other hand, the BondAdviser Income Plus Portfolio aims to outperform the RBA Cash Rate by 1.5% over the medium term (before fees) and aims to provide higher income returns than traditional cash investments (i.e. Term Deposits). Table 2. BondAdviser Model Portfolio Returns
| Index | 1 Month | 3 Month | 6 Month | 2017 YTD | 2016 | Since Inception (31/03/2016) |
| BA Income Opportunities Portfolio | 0.55% | 1.37% | 3.90% | 1.45% | 5.56% | 7.09% |
| BA Income Plus Portfolio | 0.33% | 1.21% | 1.99% | 1.03% | 4.01% | 5.08% |
Source: Hub24 as at 22nd of March 2017. Overall, investors should be aware of the potential portfolio upside inherent in strategic active portfolio management. While there are times where active security selection does not make sense from portfolio perspective (i.e. correlation between securities is high), these investment opportunities will present themselves over time. The key here is identifying these opportunities in a timely manner with thorough credit research and implementing the position within a broader portfolio context (i.e. core-satellite framework). This simplistic yet effective approach will allow investors to take advantage of company/sector specific risks and generate excess return, which is always attractive in a persistently low interest rate environment. We are witnessing a similar situation in the ASX-Listed Debt & Hybrid market where security trading margins continue to tighten across all security and issuer types. As a result, it is only a matter of time before correlation reverses and we will continue to monitor individual names under our coverage as valuations diverge on the back of key upside and downside risks specified in our market outlook.