
As we have progressed through reporting season, credit fundamentals have broadly remained intact with strong balance sheets, high liquidity and conservative capital management policies. There have been no material deviations for our investment thesis with earnings being largely credit neutral across the spectrum. However, as always, there have been winners and losers in the equity market, which has highlighted the risks around using shares as a proxy for reliable income. Figure 1. Domestic Yields 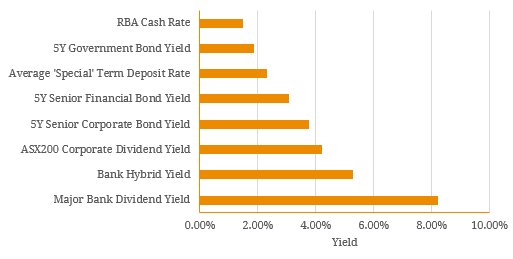 Source: BondAdviser, Bloomberg Firstly, there was the CBA which got caught up in the AUSTRAC anti-money laundering claims where it was alleged that the bank’s Intelligent Deposit Machines (IDMs) failed to report suspicious activity. According to management, this was due to a computer coding error which was subsequently fixed in 2015. CBA shares fell by ~3.9% on the day these revelations were made public (3 August 2017) and further negative sentiment has weighed on performance with CBA equity down a total of 7.9% in August. Later in the month, Telstra released its 2017 full year results and announced the outcome of its highly anticipated ‘capital allocation strategy review’ in which management conclusively decided that the group’s dividend policy was unsustainable. The group has historically paid out close to 100% of profits as dividends, but following the review (which started in November 2016), management have decided to cut dividends by up to 30% from FY18 onwards in order to preserve financial strength and flexibility in the face of rapid technological change and fierce market competition. Telstra shares fell by 10.6% immediately. Although these equities get branded as ‘blue chip’, last month’s swift market reactions highlight a risk with using shares for income. In both cases, the annual dividend yield for these respective companies was eroded meaning future dividends will be utilised to recoup capital losses. Given one of the foundations of income investing is capital preservation, shares evidently do not fit this criterion. While it can be easy to get drawn into the additional yield associated with equities, this must be balanced against the capital volatility expected over the investment horizon. Figure 2. Rolling Total Annual Equity Returns for CBA and Telstra
  Source: BondAdviser, Bloomberg If we analyse a hybrid’s return composition in the same manner, we can see that capital volatility is lessened. To reflect similar company-specific risks, we have utilised CBA PERLS III (ASX: PCAPA), which was redeemed in March 2016. Note than the running yield for an income instrument is calculated in the same way the dividend yield is calculated for equities. In normal conditions, return volatility remains broadly range bound but in a distressed scenario, the instrument follows a similar behaviour to CBA equity. Given Tier 1 hybrids sit above equity on the capital structure, this is a reasonable response. Figure 3. Rolling Total Annual Return for CBA Perls III (ASX: PCAPA)
  Source: BondAdviser If we move further up the capital structure, the return volatility is even lower. Figure 3 shows the return composition of a senior floating rate CBA and Telstra bond. However, due to the shorter tenor for these fixed income instruments, the return composition shown is shorter than the preceding charts. Nonetheless, the positive relationship between return volatility and seniority holds. Figure 4. Rolling Annual Return Composition for CBA and Telstra Senior Floating Rate Bonds
  Source: BondAdviser While yield is important, it is almost pointless without capital preservation. As an investor moves down the capital structure, capital volatility will increase and the stability to regular income streams becomes increasingly difficult on a total return basis. For this reason, investors should be aware that fixed income is a two-way game (i.e. yield and capital) and higher yield will always mean higher risk. Equity investors of CBA and Telstra recently experienced this the hard way and should be a constant reminder that the asset class is classified as a growth asset while traditional fixed income is perceived as a defensive asset. Figure 5. 5-Year Return Volatility in ‘normal conditions’ (excl. GFC)
  Source: BondAdviser
An employee-owned financial services provider focused on the Debt Capital Markets.
© Bond Adviser Pty Ltd ‧ ASFL 456783 ‧ ABN 31 164 148 467 ‧ Important Information
This site is protected by reCAPTCHA and the Google Privacy Policy and Terms of Service apply.
© Bond Adviser Pty Ltd ‧ ASFL 456783
ABN 31 164 148 467 ‧ Important Information
This site is protected by reCAPTCHA and the Google Privacy Policy and Terms of Service apply.