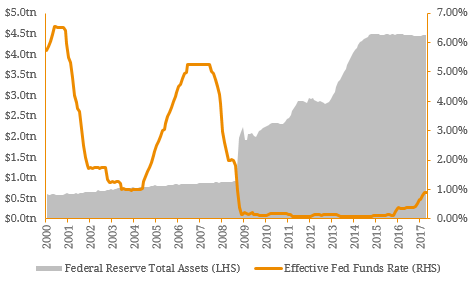
As largely anticipated, the Federal Reserve two weeks ago raised US interest rates for the fourth time since the Global Financial Crisis (GFC). In addition to the rate hike, the Federal Open Market Committee (FOMC) also announced it “intends to gradually reduce the Federal Reserve’s securities holdings by decreasing its reinvestment in the System Open Market Account.” This indicates the Committee’s plans to reverse its Quantitative Easing policy. Post the GFC, the Fed spurred economic recovery by purchasing large quantities of Government (Treasury) bonds and mortgage-backed securities. The rescue, known as Quantitative Easing, was designed to promote economic growth by keeping long-term interest rates low and injecting liquidity into a stagnate financial system. In the process, the Fed’s balance sheet reached unprecedented levels to peak at $US4.5 trillion in October 2014. While the Fed stopped purchasing securities in 2014, it refrained from shrinking its balance sheet (i.e. reinvesting the matured proceeds into new securities) amidst a fragile economy. Figure 1. Federal Reserve Balance Sheet and Effective Funds Rate (short term interest rate)  Source: Federal Reserve of St Louis However, with the current rate hike and FOMC’s optimistic forecasts for 2017 and beyond (known as the Fed dot plot), the committee believes a “normalization of the level of the federal funds rate is underway” and has announced it will progressively (yet cautiously) unwind the balance sheet. The Fed’s expects to gradually allow its assets to roll off, meaning it won’t reinvest the maturing principle into new securities. Initially, up to US$6 billion in Treasury Bonds and $US4 billion in Mortgage-backed Securities (MBS) will be allowed to roll off monthly. Consequently, these caps will be raised quarterly until they hit $US30 billion for Treasury Bonds and $US20 billion for MBS. There is no indication of when this process would begin. Notably, the committee pointed out the Fed will have a balance sheet “appreciably below that seen in recent years but larger than before the financial crisis” due to higher reserve requirements for banks. Nonetheless, this implies a sizeable reduction of liquidity in the market and it is unclear how disruptive this normalisation process (‘Tapering’) will be to yields. This disruption was evident in 2013, when the ex-Chairman of the Fed Ben Bernanke suggested the proposition of Tapering with markets reacted violently (known as the media dubbed ‘Taper Tantrum’). Although the market leveled out eventually, there was an immediate surge in long-term interest rates highlighting the sensitivity of the situation. While there was potential for a second ‘Taper Tantrum’ in light of Fed Reserve’s new plans to unwind the balance sheet, the 10Y treasury yield was generally non-reactive to the Fed’s announcement. Figure 2. 2013 Taper Tantrum
  Source: Bloomberg Figure 3. 2017 Taper Tantrum (Not)
  Source: Bloomberg Tapering expectations are important but in our opinion, inflation expectations are the current primary driver of long term interest rates. The issue is that market expectations are at odds with the FOMC which is forecasting a ‘long-run’ rate of 3.00%, well below the 10-Year Treasury Yield of ~2.20%. Realised US inflation has has slowed throughout 2017 despite a 16-year low in the unemployment rate but the Fed has noted “it’s important not to overreact to a few readings and data on inflation can be noisy”. This suggests financial markets are yet to believe the Fed’s optimistic forecasts are credible and for this reason, interest rate volatility may persist until there is better alignment in US economic data. However, with most central banks who engaged in Quantitative Easing hinting these programs may come to an end in the near term, the case for higher yield curves persists and it is likely we have seen the trough in the global interest rate cycle. As Figure 3 depicts, expectations for real US economic growth remain intact post the presidential election of Donald Trump back in November 2016 suggesting financial markets are still pricing in a pro-growth agenda. However, with weak economic data and misalignment of expectations, uncertainty remains which we will explore in more depth in our mid-year outlook next month. Figure 3. US Real Growth Expectations
  Source: Bloomberg
An employee-owned financial services provider focused on the Debt Capital Markets.
© Bond Adviser Pty Ltd ‧ ASFL 456783 ‧ ABN 31 164 148 467 ‧ Important Information
This site is protected by reCAPTCHA and the Google Privacy Policy and Terms of Service apply.
© Bond Adviser Pty Ltd ‧ ASFL 456783
ABN 31 164 148 467 ‧ Important Information
This site is protected by reCAPTCHA and the Google Privacy Policy and Terms of Service apply.