Fixed Income Research
Investment Strategy
At the Breakdown: Fixed Income State of Play
We have deep dived into fixed income markets, searching for value before the ruck forms. Despite an awfully weak inflation print, we have little faith in the long end, believing more is needed to understand if pricing pressure is indeed transitory. Ultimately, we believe the RBA will continue to offer robust support and see three-to-six-year govies as offering a worthwhile compromise.
In public credit, in almost all circumstances, spreads sit near all-time lows. We review more recent domestic issuance, with the belief that new issue concessions remain present. Finally, we turn to the capital structure of financials, noting we are underweight senior unsecured bonds and continue to see future compression at the AT1 hybrid level.
Duration
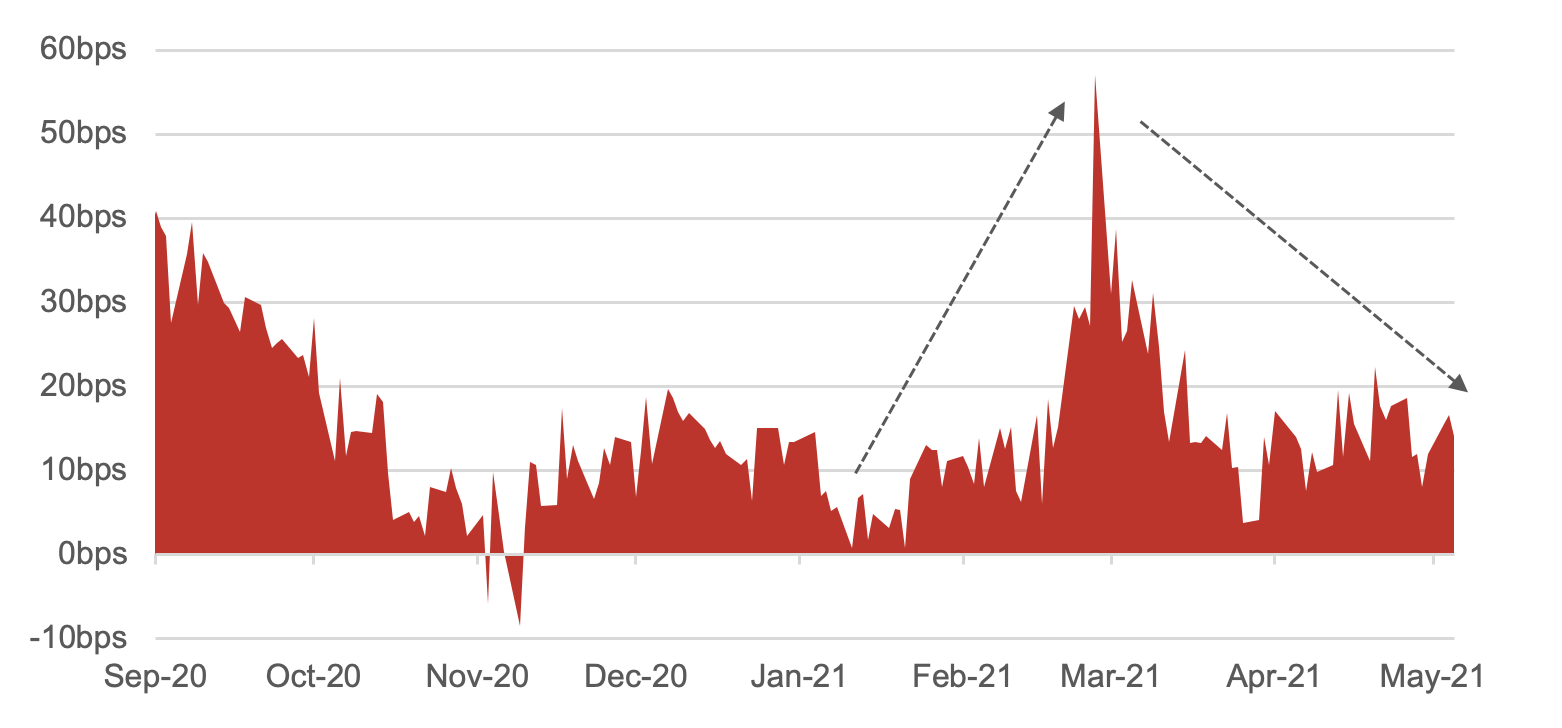
AUD/USD 10Y Treasury Spread – Recovery Outperformance Lost Steam
 (Figure 1 – Source: BondAdviser, Bloomberg. As at 5 May 2021. Uses Bloomberg Generic Pricing)
There remains bifurcation between developed and developing economies in terms of controlling and vaccinating against COVID. This is impacting the speed of economic recoveries worldwide. Positively, there is generally strong data in terms of an economic recovery for both Australia and the world’s largest economy, the US.
Locally, the blundered vaccine rollout will delay opening borders, it is hard to quantify this impact. Whilst still dramatically elevated, domestic saving rates are falling. Normalisation to pre-border saving rates would be ideal – as the optics are not great on domestic savings being spent on overseas travel and tourism. Spending on cars, boats, jet-skis and houses suggests many are adjusting their spending habits to the new normal.
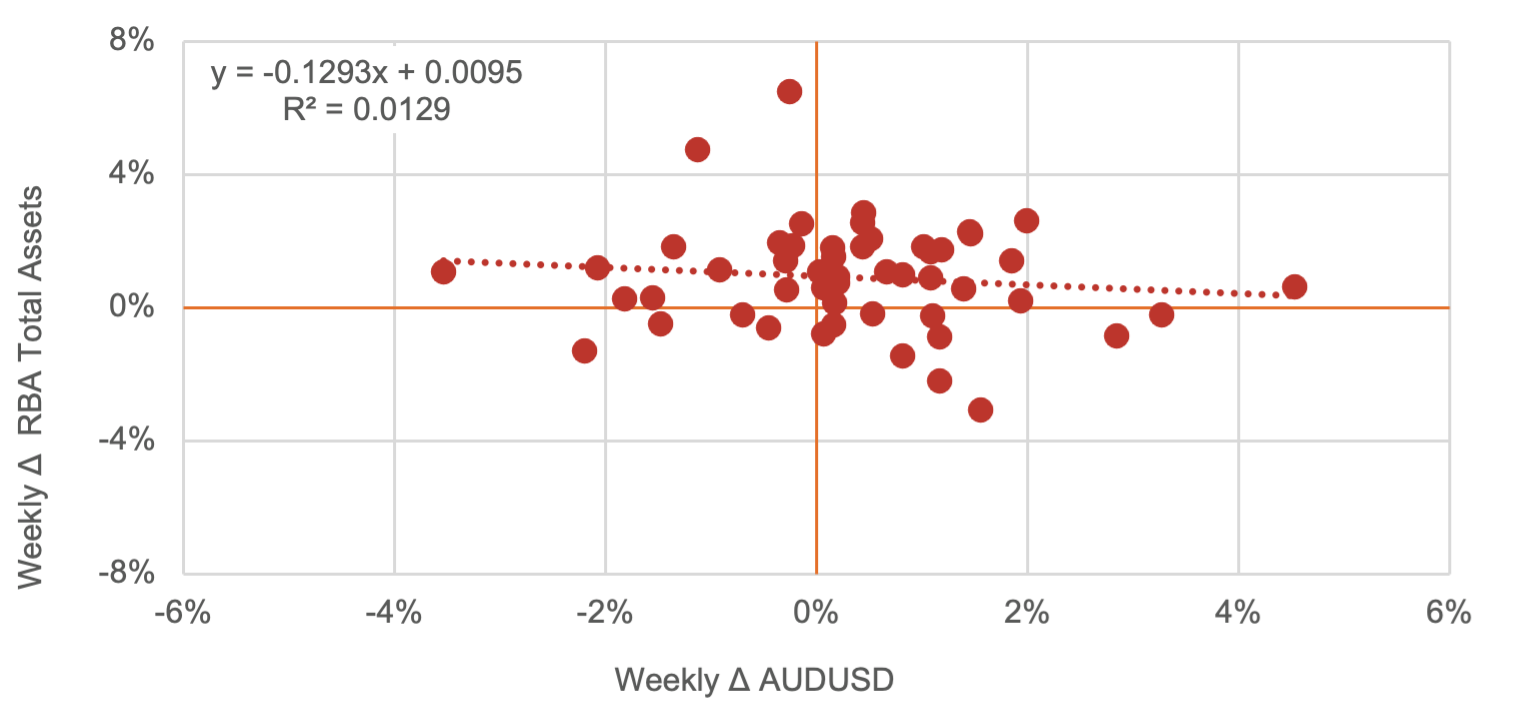
Recent weakness in the domestic inflation print, alongside RBA jawboning and strong US data, has seen compression between AUD / USD equivalents in the Treasuries market. In late February, there was almost a 60bps differential between the US and Aussie 10 year. This has now fallen to about 15bps. As this spread gets smaller (or negative), the attractiveness of US Treasuries on a relative basis will be supportive of a lower Aussie dollar. The RBA would be happy to see such an outcome, and QE policy is near-directly designed to have such an impact. Our simplistic analysis in Figure 2, suggests the relationship between asset-purchases and exchange rates is far more complex than just inverse, making it difficult to judge the first-order efficacy of QE policy.
RBA Assets vs AUDUSD – What is it All For?
 (Figure 2 – Source: BondAdviser. Bloomberg, RBA. As at 5 May 2021. )
Recently, treasury yields have found support and been largely rangebound. Both USD and AUD treasuries have been buoyed by (1) overseas investors and (2) liability matching investors, who are taking advantage of elevated yield buying opportunities.
The key word on markets mind is “transitory”. In other words “not permanent”. Whether structural inflation will re-appear is difficult to gauge and not our area of expertise. What is easier to gauge is pricing pressures. As we feared in March, if inflation takes-off temporarily, it may become a self-fulfilling prophecy structurally.
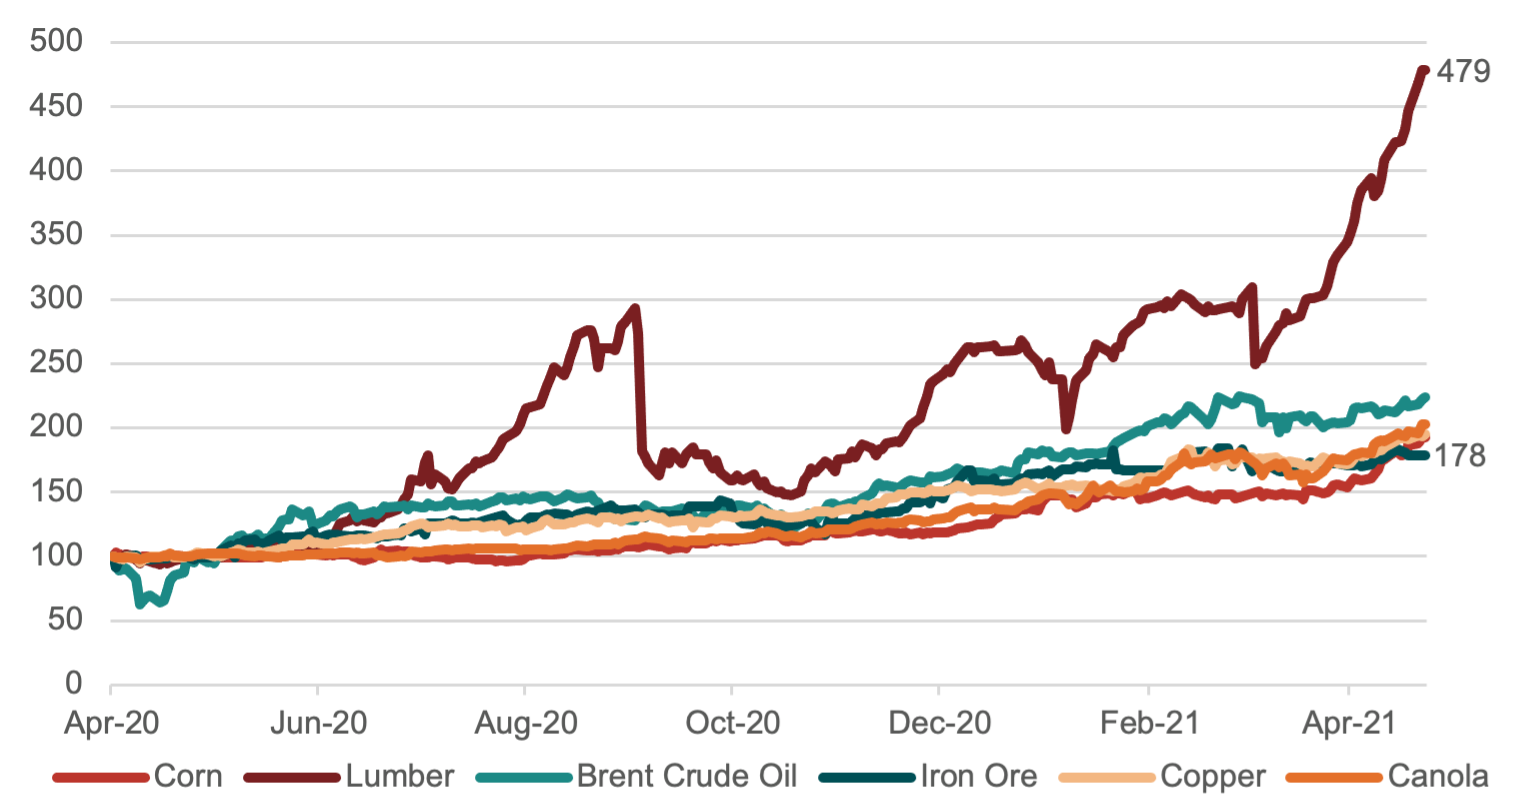
Pricing in commodities, which are raw-inputs for goods, is boom-like. Suggesting, as we first opined in May 2020, there are structural supply side issues at present. Over time this will naturally decrease unless anti-globalisation rhetoric continues to heat up. Escalating tensions between China and the western world suggests the more expensive option; self-reliance of critical industries, may be in political favour. This is evident in Australia’s decision to build its own hypersonic missiles.
Normalised Prices: Corn, Canola, Copper, Iron, Oil and Wood.
 (Figure 3 – Source: BondAdviser, Bloomberg. As at 5 May 2021. Generic pricing used.)
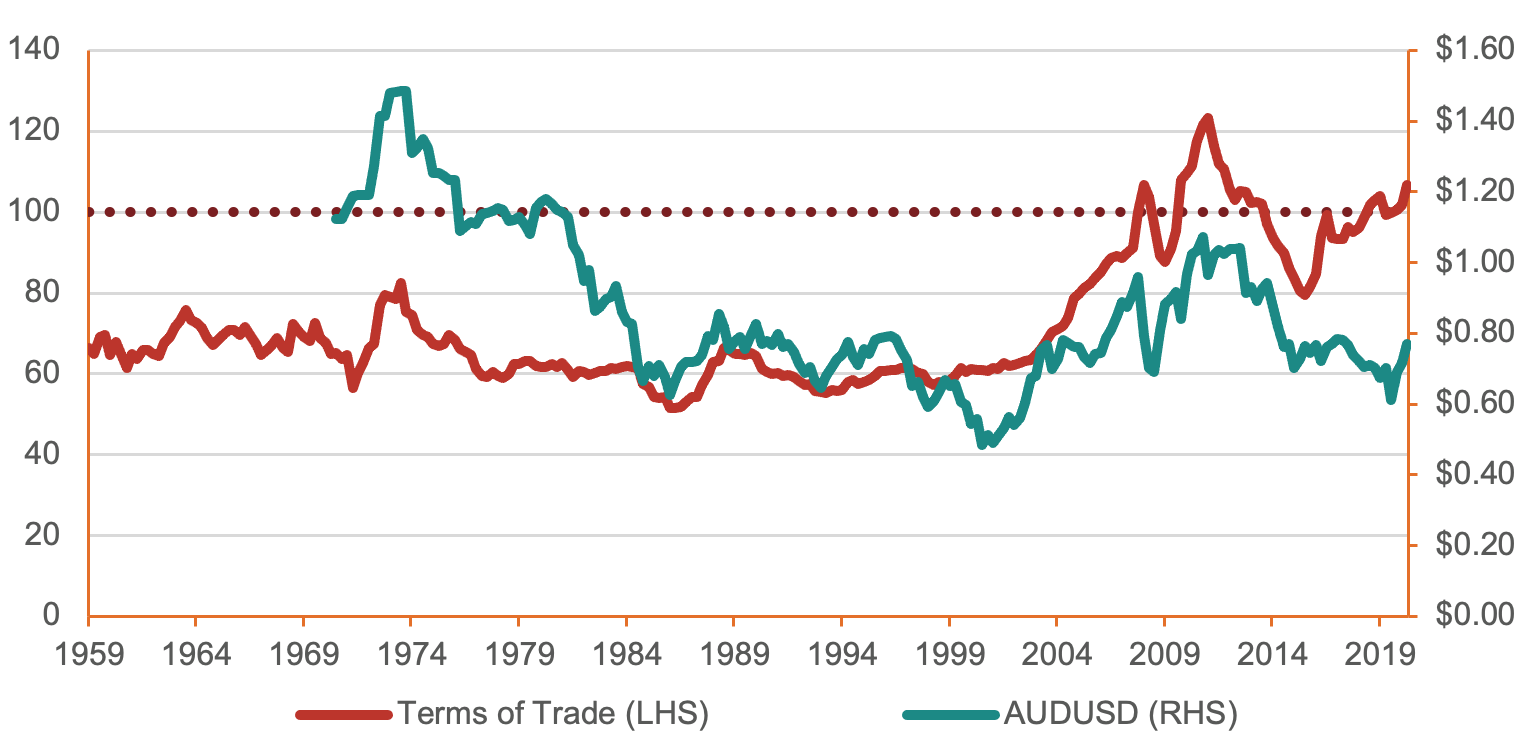
This commodities boom has been fantastic for the domestic terms of trade. Australia’s terms of trade is calculated as the ratio of export prices to import prices. When this index increases, it means Australia is receiving relatively more for its exports; if it decreases then we are receiving relatively less. An increase in export prices relative to import prices indicates that Australia is better off. A fall in the terms of trade means more goods and services must be exported to maintain the same level of imports.
Domestic Terms of Trade – Commodity Boom at Work
(Figure 4 – Source: BondAdviser, Bloomberg, ABS. As at 5 May 2021. Seasonally adjusted figures.)
Because most goods and services that Australia trades on the international market are bought and sold under contracts denominated in US dollars, the value of the Australian dollar in terms of the US dollar has a largely positive association with the terms of trade. Elevated commodity prices continue to place upwards pressure on the AUDUSD. This will slow the domestic recovery; hence the RBA’s supportive policy is designed to offset the terms of trade impact on the currency. This is a key reason why we continue to see RBA support into the future. The level of support will not just need to be maintained but increased.
Expectations on Future Average Inflation
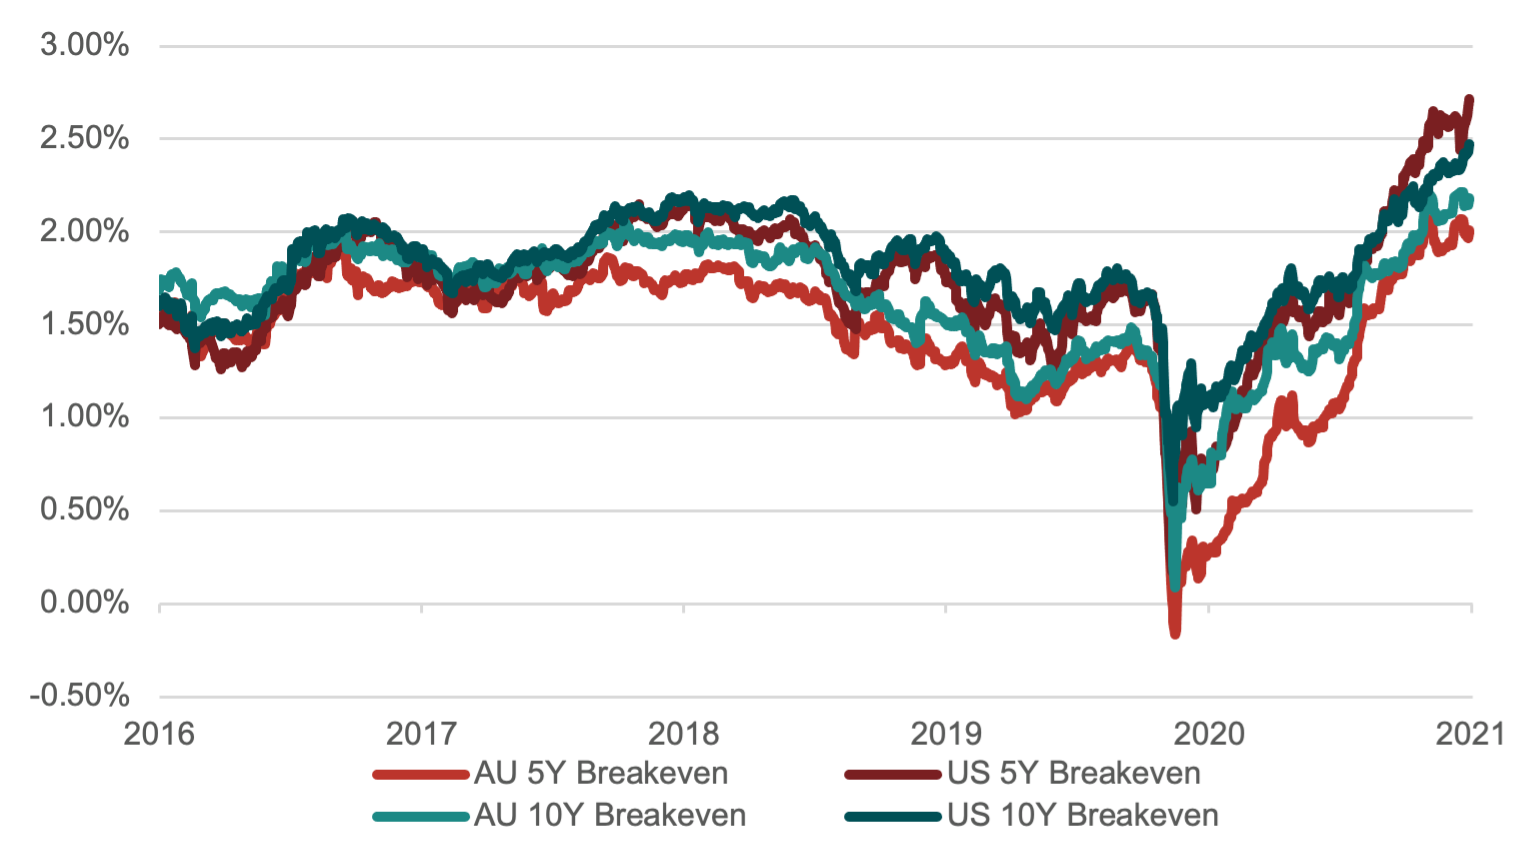
(Figure 5 – Source: BondAdviser, Bloomberg. As at 5 May 2021.)
Breakevens price the implicit average inflation rate over a defined timeframe. As seen in Figure 5 they now sit far above prior highs over the past five years. A continued surge, or even a plateau suggests markets disagree on the transitory narrative. Average US inflation for the next ten years is being priced in at 2.50%. The last time the trimmed mean PCE inflation rate in the US broke 2.50% was in 2008.
It is arguable, that the “transitory” inflation spike is biasing breakevens upwards and that longer-term inflation expectations are more muted. Forward breakevens are the implicit average forecast for a period of time, some time in the future. In other words, the five-year average in five years’ time (5y5y). This measure cuts away front-end noise – precisely eliminating any impact of a non-permanent near-term spike. Figure 6 affirms that markets do expect future inflation rates to be nearer to the 2.50% mark. This is notable, given a technical point that over the next few months, large sequential price increases will mean a high base effect when doing year-on-year comparisons in 2022. This will make overshooting inflation goals even more difficult.
Forward Breakevens Suggest Structural Inflation Pressures Building
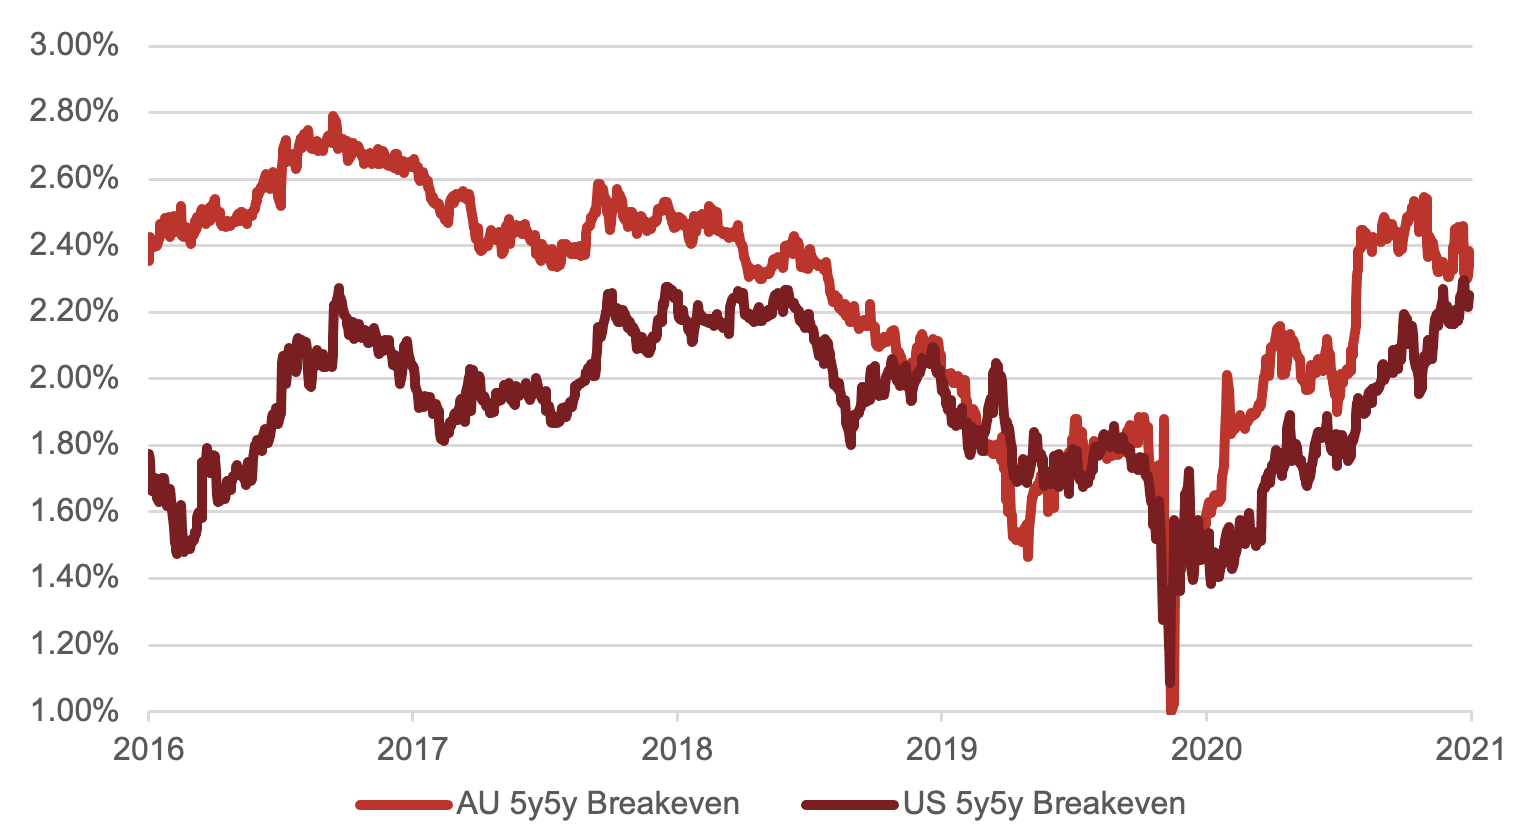
(Figure 6 – Source: BondAdviser, Bloomberg. As at 5 May 2021.)
Domestically, our 5y5y forward breakeven swap has traded range bound near 2.50% since December 2020, with some more recent softening. Contrastingly, the US has been consistently rising since July 2020 and is now very much approaching the point of non-transitory. The Fed will be alert to this measure of forward breakevens, having referenced it before. Continued movement upwards here may force the Fed’s hand.
Broad Money vs CPI (YoY, SA) – If it is Coming, it Must be Soon
(Figure 7 – Source: BondAdviser, Bloomberg. As at 5 May 2021. RBA Trimmed Mean CPI has 3-month lag.)
There are many theoretical ways to analyse inflation and what drives it. One is that price levels are a function of the supply of goods, supply of money and the velocity in which money moves around. Many in markets understand that money supply has rocketed through pandemic stimulus measures. This was partially offset by a reduction in credit.
The reduction in credit domestically seems a distant memory, with new home lending off the charts. Cuts to interest rates and changes to serviceability requirements has made borrowing easier and cheaper than ever – and of course this is influencing housing prices. New loan commitments for housing in Australia now stand at a record $30.2 billion. Surprisingly, despite all FHB grants and support, investor demand has accounted for more than half the overall rise. The trip to Aspen is being substituted for the humbler four walls and roof investment property financed at record low mortgage rates. Investor lending has seen sustained growth now since 20-year lows in May 2020. The 12.7% rise for March in investment lending is that largest recorded since 2003. We place the RBA at the core of the housing overheating. Given this policy action appears to be doing little to stimulate inflation but actually lighting a fire under an already powder barrelled housing market, we think some harder questions need to be asked about efficacy in Martin Place.
Horse Has Bolted – Total New Housing Lending
(Figure 8 – Source: BondAdviser, RBA. As at 5 May 2021. 50 month moving average.)
The larger offsetting impact to record money supply has been the dramatic fall in money velocity. In theory, this is the reason why we are yet to have seen any inflation. In our opinion, it seems logical that when all this new money is able to circulate more frequently, particularly in the US, we will see sustained pricing pressures.
How to Not Spend It – US Velocity of Money (SA)
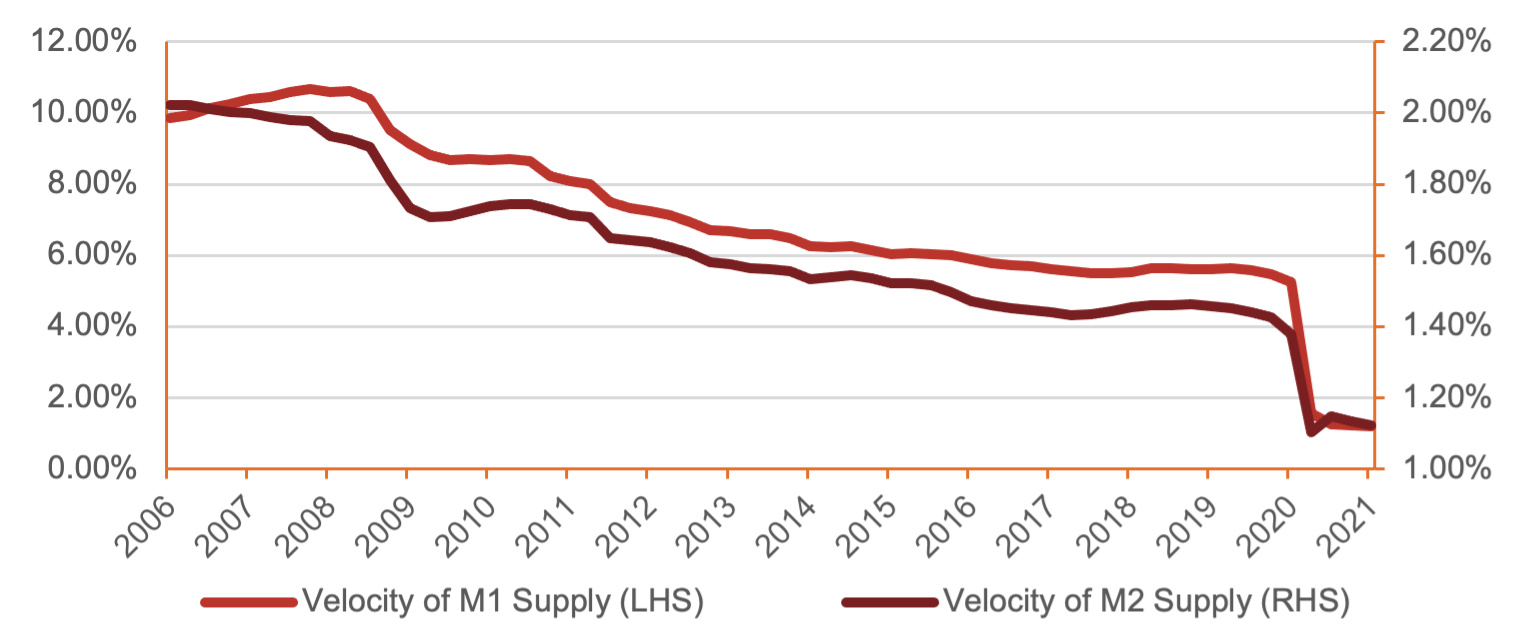
(Figure 9 – Source: BondAdviser, Bloomberg. As at 5 May 2020.)
As seen in Figure 9, velocity in the US has fallen off a cliff. However, the re-opening present in states may begin to reverse this impact. With such a fall in velocity, it should be no surprise that core inflation also fell.
We struggle to find any current measure of money velocity in Australia, however, we have used Westpac’s card data indicator as a proxy. This is based on millions of credit and debit card transactions that Westpac process daily. The focus of this data is consumer spending. Whilst by no means perfect, it suggests velocity in Australia should be in a better position than the US. This is entirely appropriate given the length of time the Australian economy has been reopened, even in bubble status, compared to the US, which has endured waves of opening and closing across the various states. This reiterates our continued expectation inflation will emerge sooner in Australia than the US.
How to Spend It – WBC Card Tracker Index*
![]()
(Figure 10 – Source: BondAdviser, Westpac. As at 5 May 2021. * Indexed based on spending compared to the same period in 2019, relative to a baseline period (eleven weeks immediately prior to national lockdown Stage 1))
Our global PMI heatmap is greener than the spring for developed economies, suggesting it is a matter of time until businesses will be forced to pass through cost increases to consumers. The alternative is corporate profitability falls.
PMI Heatmap (Developed Economies in Bold)
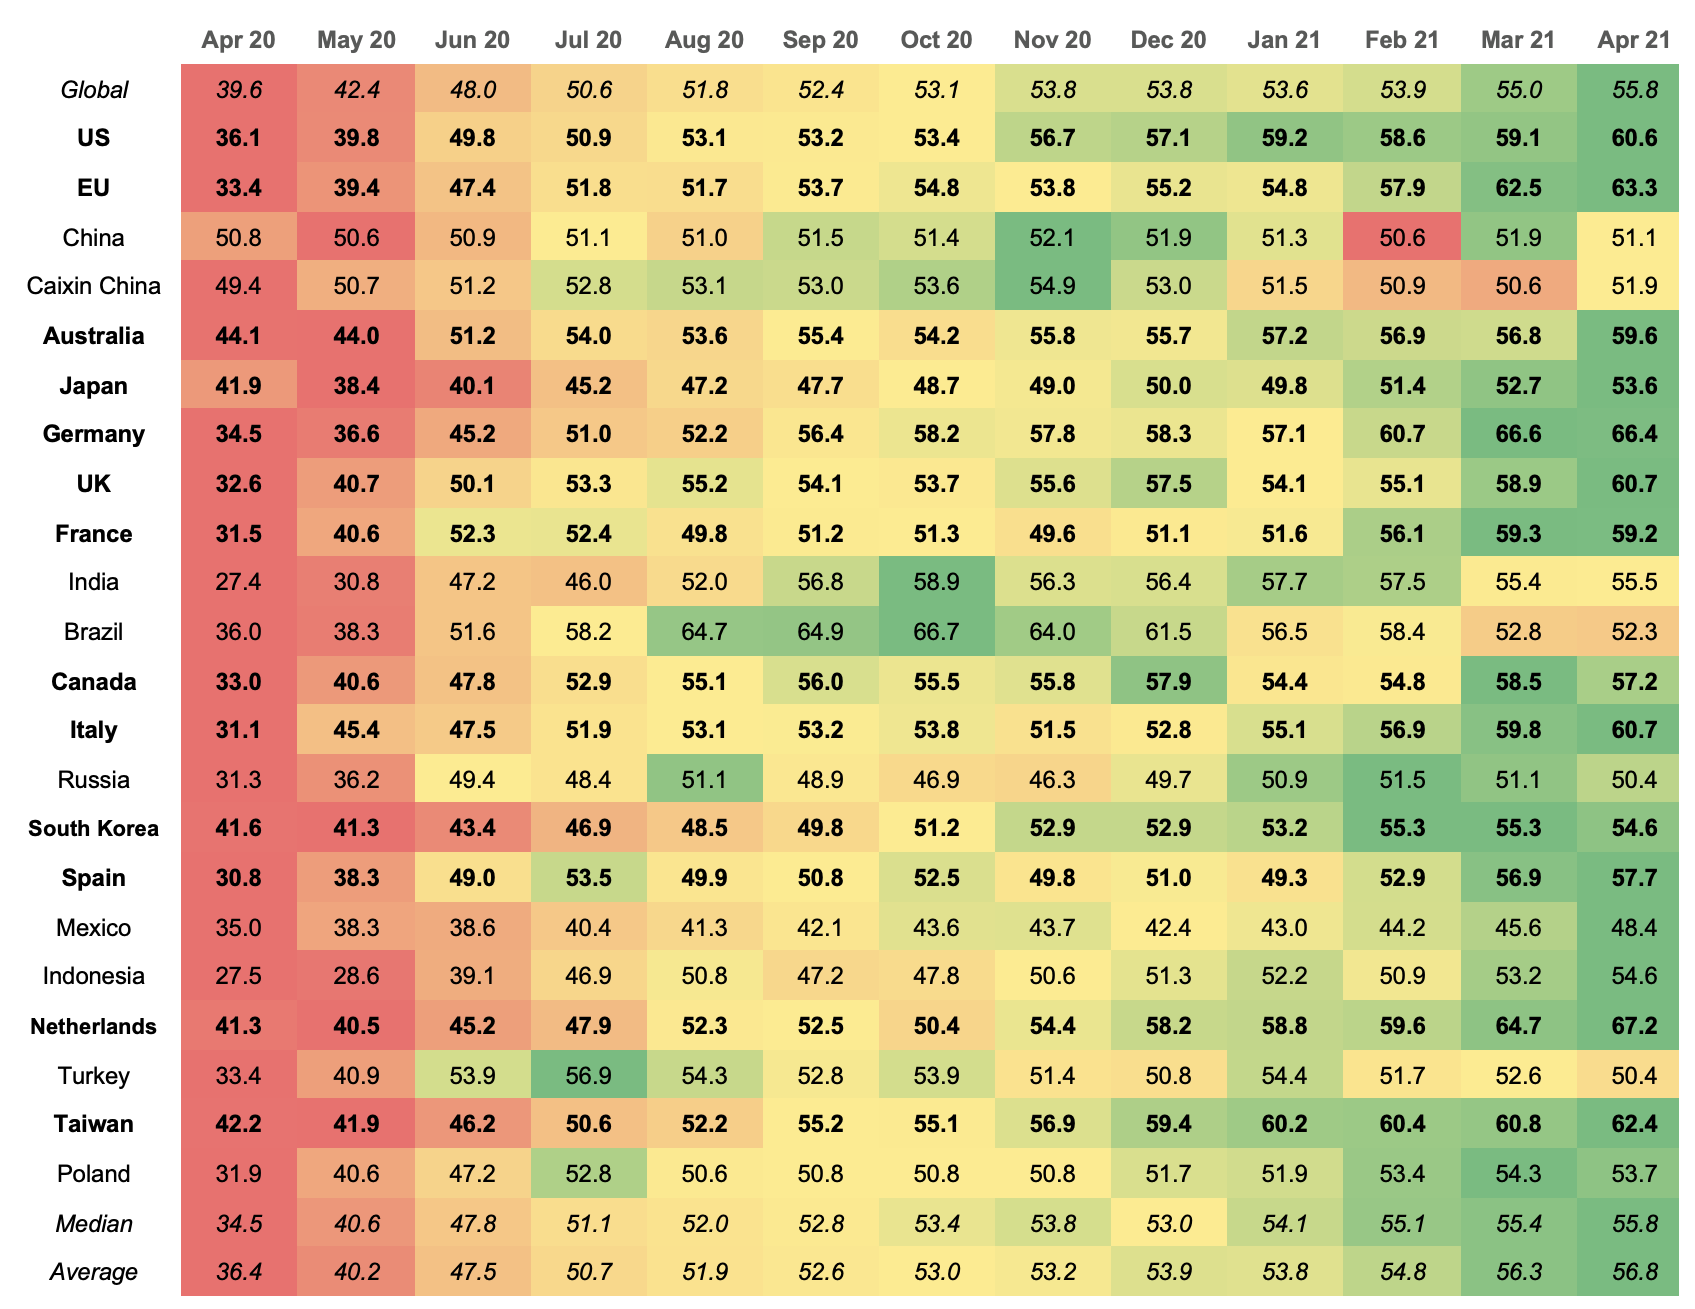
(Figure 11 – Source: BondAdviser, Bloomberg. As at 5 May 2021.)
Despite these pressures on inflation, the domestic print did not budge. We cannot hide from it either – it was much weaker than we or the street expected. There was a modest 0.6% lift in March quarter (vs 0.9% consensus) and the annual pace accelerated marginally from 0.9% to 1.1% (vs 1.4% consensus).
Inflation Breakdown
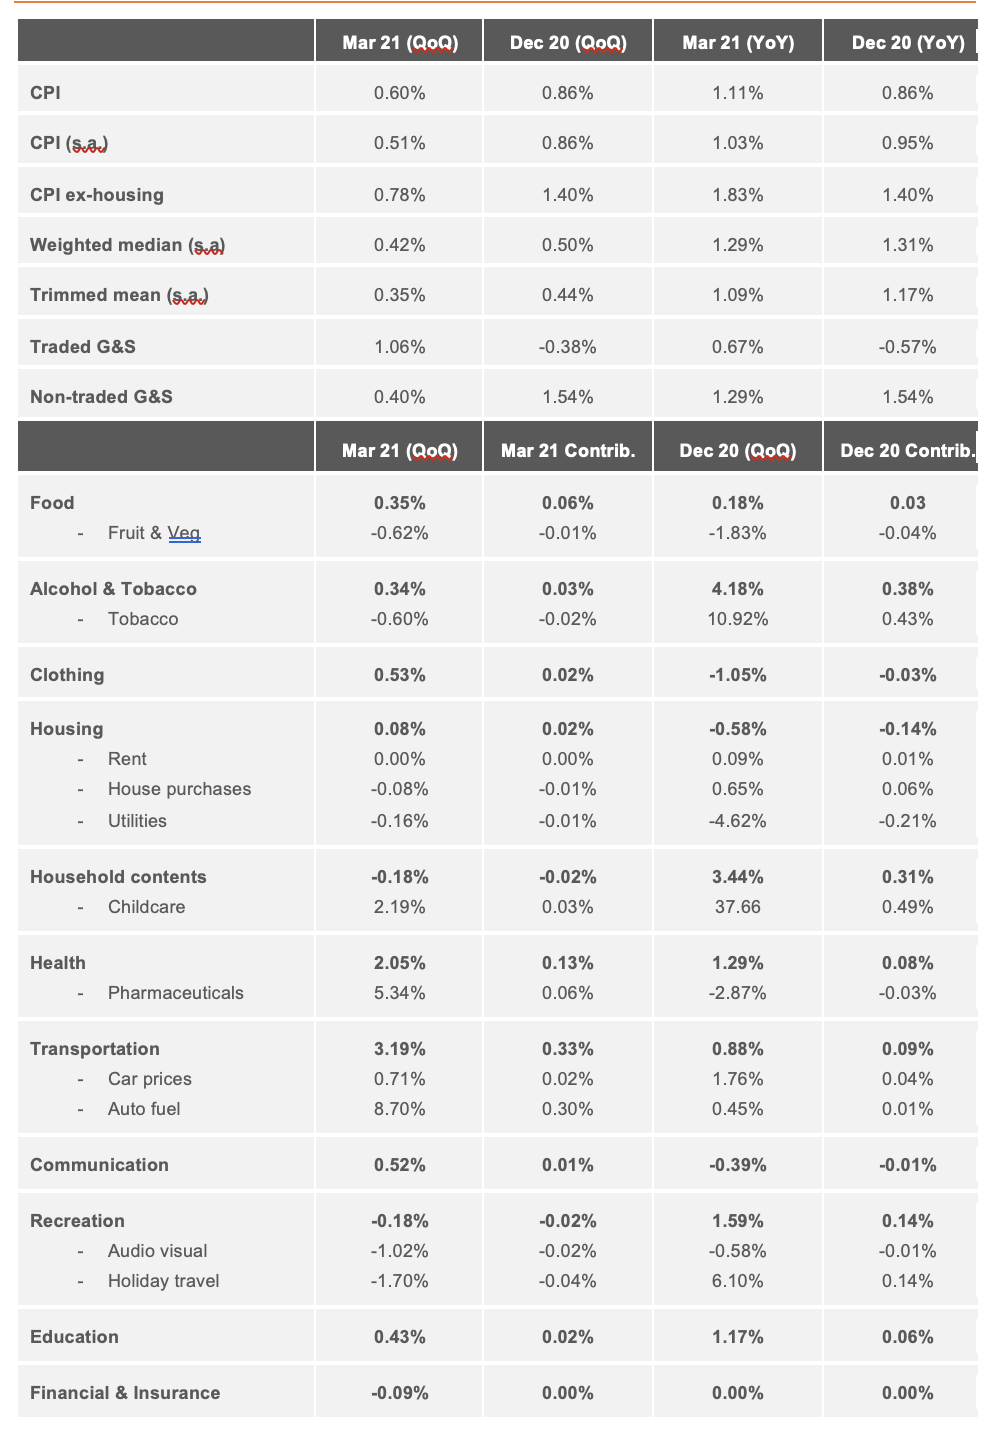
(Figure 12 – Source: BondAdviser, RBA, ABS, Westpac. As at 5 May 2021.)
Government taxes, grants and subsidies continue to violently shake the CPI. Staggeringly, in the face of dramatic housing prices increases, dwelling prices fell (-0.1%) due to additional government grants. Food prices also fell below expectations (0.4% vs 1.4%), as fruit prices moved downwards. Tobacco surprisingly fell (-0.6%) but expect this to come full circle when excise repricing is passed on. The rise in education (0.4%) was modest due to government assistance alongside a fee freeze at private schools although we are yet to hear of any anecdotes in this space! Unsurprisingly, the continued increase in oil prices lead to an 8.7% rise in auto fuel in the quarter.
The annual pace of trimmed mean CPI eased to 1.1%, a record low in this time series. This soft print indicates there remains a lack of broad inflationary pressures domestically. We believe this will force the RBA to expand its QE program.
Whilst the RBA is acutely aware of the diminishing marginal benefit of continued balance sheet expansion, data from other developed economies suggest more quantitative easing can be digested without breakdown of traditional market mechanisms. On the other hand, looking at Japan for the past ~30 years and Europe for the past decade, suggests Australia and the US may get stuck in the trap of zero rates.
Scope for Further Support is Present (Net Debt % of GDP)
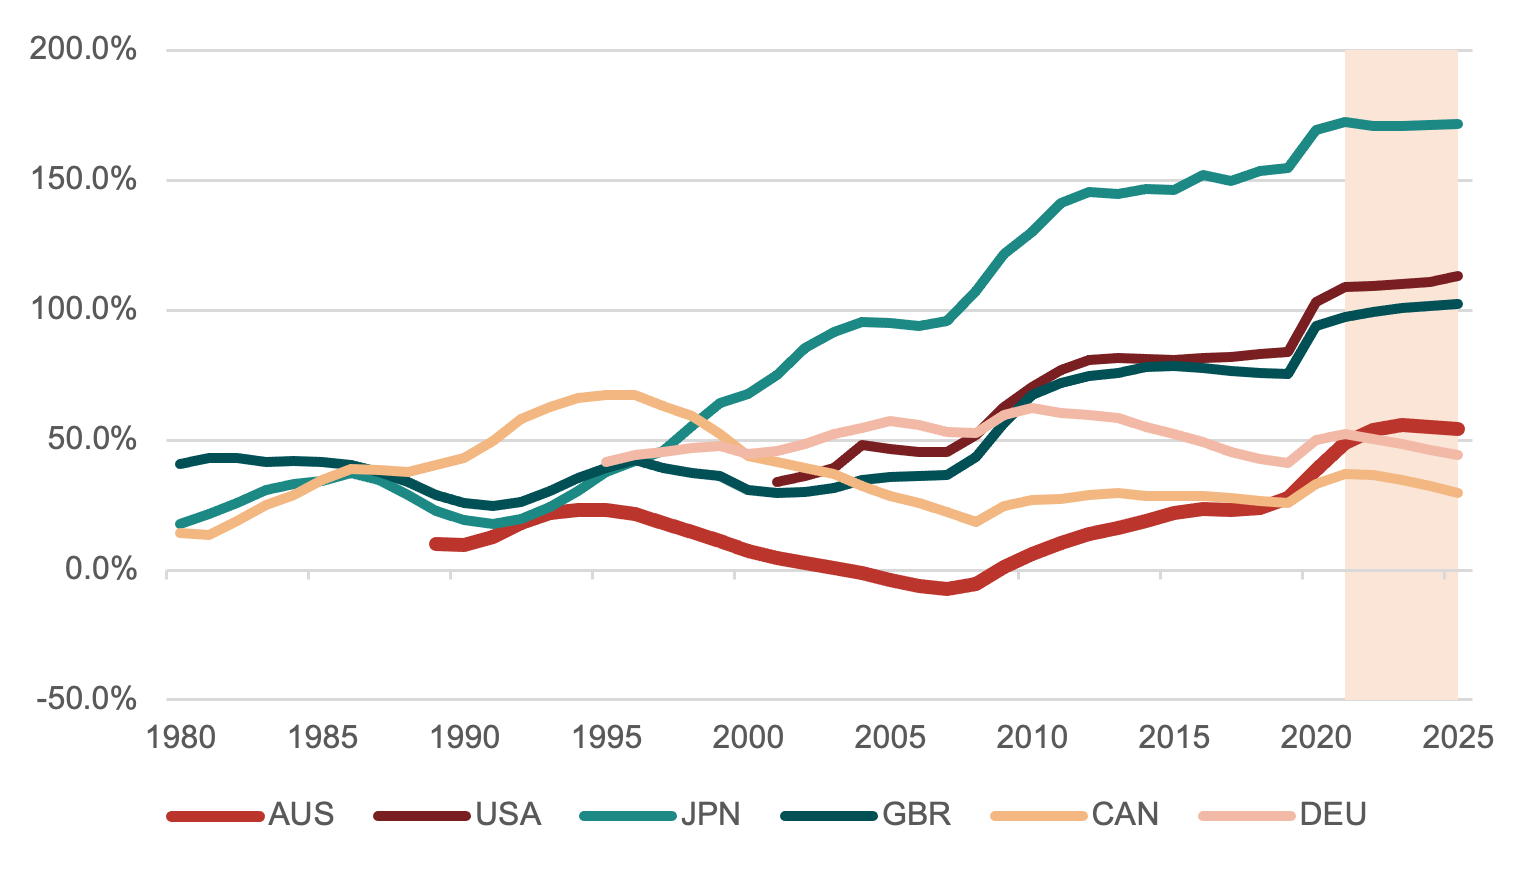
(Figure 13 – Source: BondAdviser, Bloomberg, IMF Forecasts. As at 5 May 2021.)
A mild benefit for the young taxpayer, is that we expect the government deficits, (Commonwealth and for most states) to be lower than forecast in FY21. The RBA is likely aware of this, given the rise in commodity prices and resurgence in house sales. Unfortunately, this backs the RBA into more of a corner, requiring it, once again, to shoulder more of the burden in stimulating the economy.
Employment Remains Well Above Lows (ANZ Job Ads Inverted)
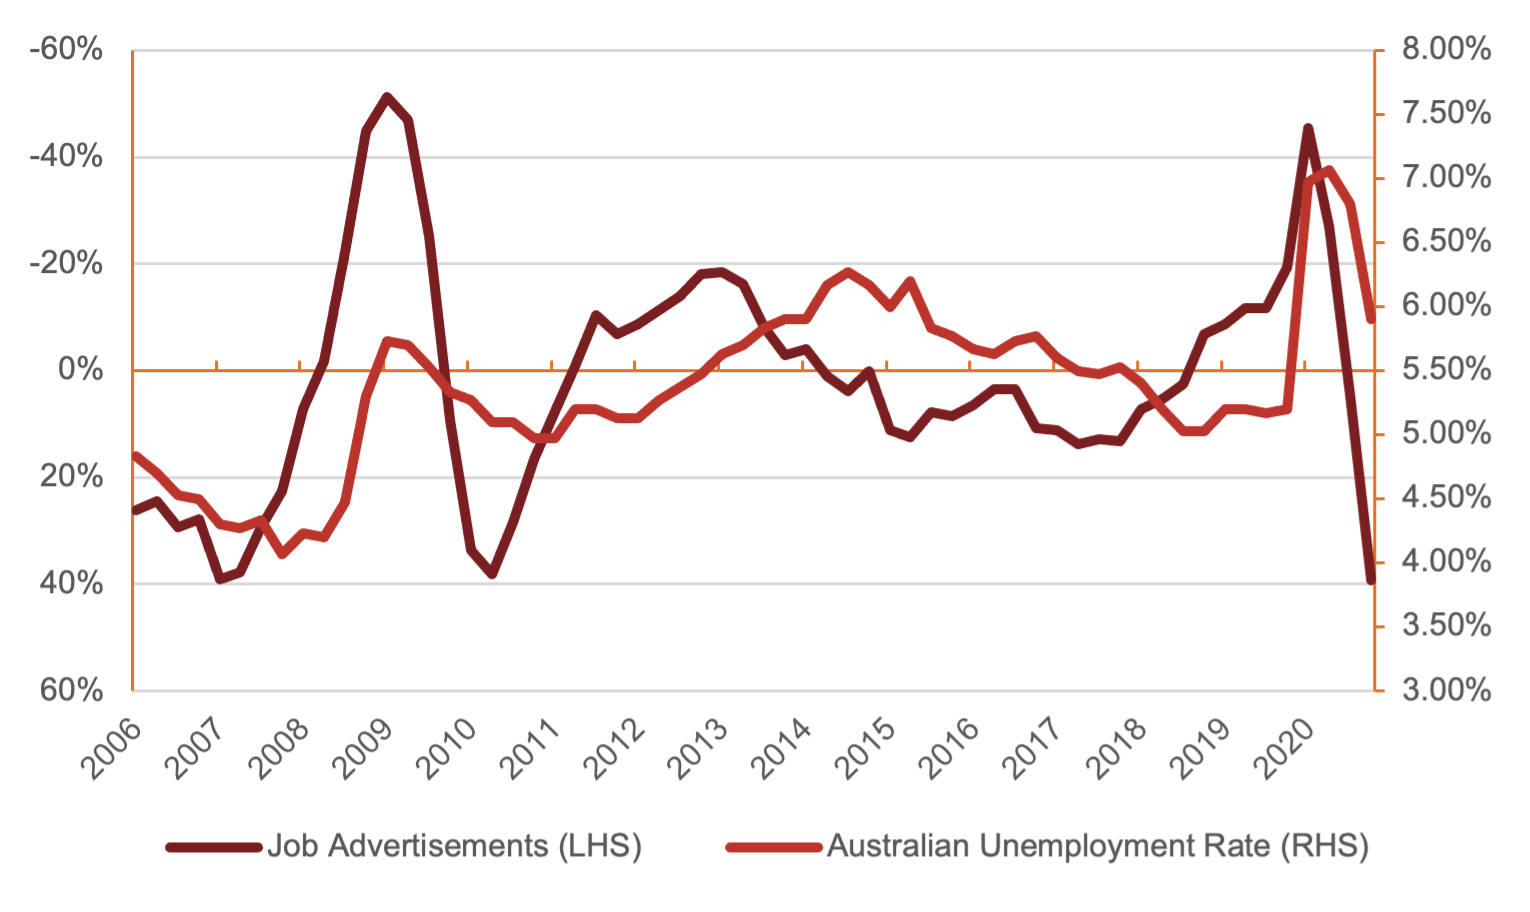
(Figure 14 – Source: BondAdviser, Bloomberg. As at 5 May 2021. Both year on year and seasonally adjusted.)
A real upside surprise has been the bounce in employment. Whilst we expected some elasticity here, the rebound has surpassed most of the street’s expectations. Unfortunately, the domestic economy is far from pre-COVID levels and miles away from a 4.00% number where we would expect wage pressure to start being a genuine inflation trigger. Job advertisement data is extremely positive, as evidenced in Figure 14, suggesting employment conditions will continue to improve. We are cautious on the speed of re-employment, expecting an unemployment rate below 4.50% to take considerable time. Consequently, the RBA have more ammunition to maintain its mandate of considerable support.
We believe that in the July meeting, the RBA will extend the three-year yield target out to November 2024. It can always walk this target back later should the economy improve, however, with the TFF being wound back, further support to counter this offset seems appropriate.
The ACGB ¼ November 2024 bonds is a two-for-one trade in our opinion. We see capital appreciation present in either of the scenarios of yield curve target extension or the RBA purchasing further bonds further out the curve.
AUD 3Y Yield Target – Roll is Attractive
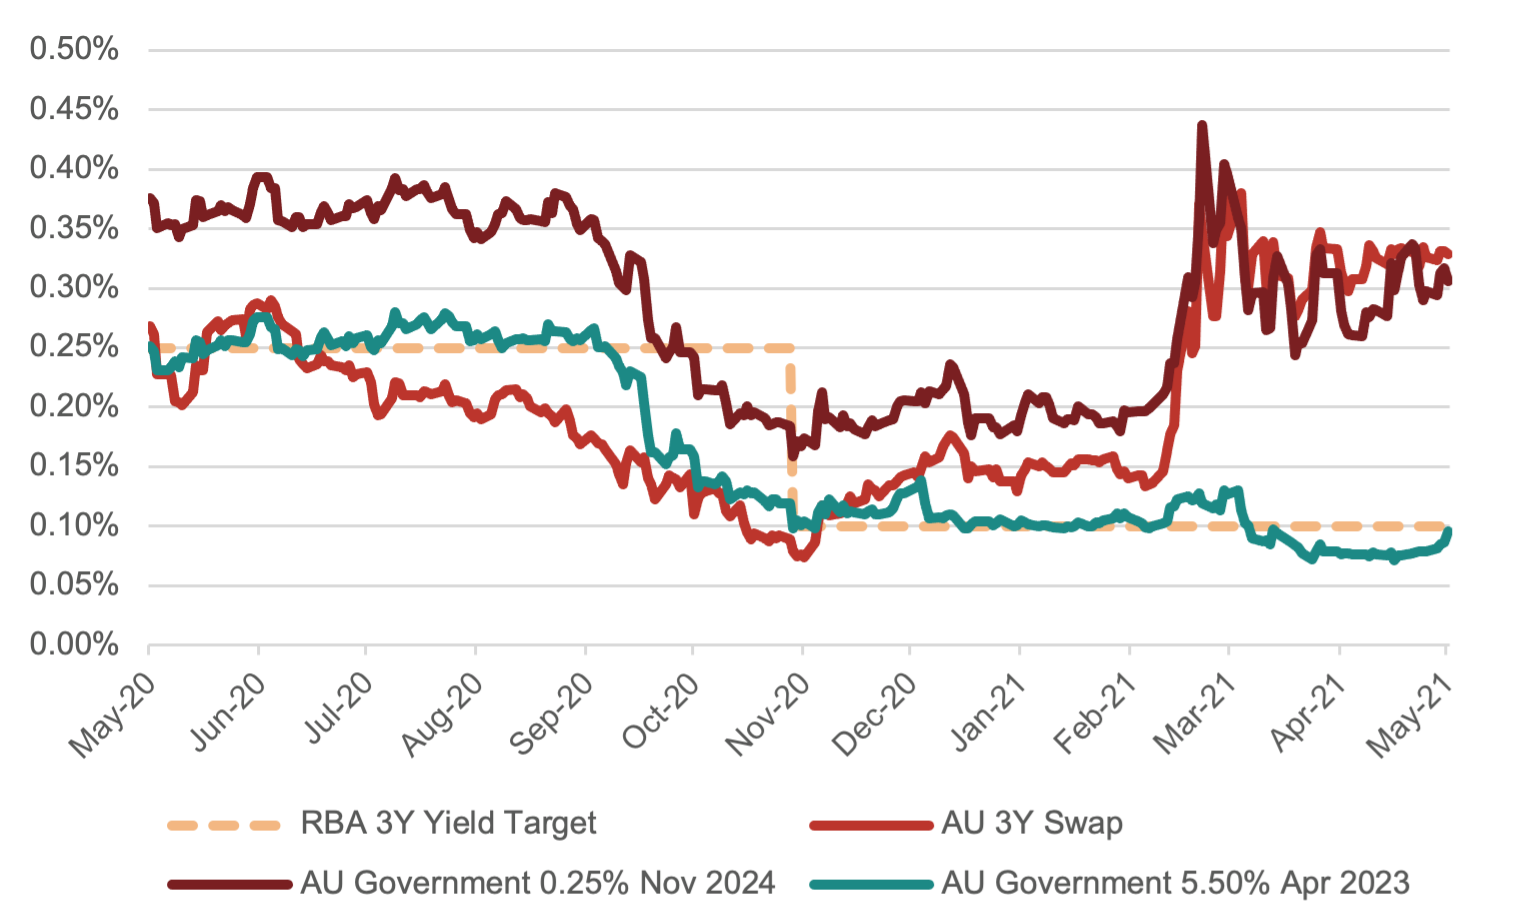
(Figure 15 – Source: BondAdviser, Bloomberg. As at 5 May 2021)
3-6Y Preferred AUD Sovereign Exposure
(Figure 16 – Source: BondAdviser, Bloomberg. As at 6 May 2021. )
We firmly believe inflation pressure is brewing. However, the long-term structural impact is difficult to forecast. It is also challenging to ascertain directional confidence at this point in time. However, we have become mildly more acceptable of duration – the RBA remains steadfast in its targets and weak inflation and employment numbers means continued stimulus is required. Whilst the market may lose faith, we think this manifests in another three to six months’ time, compared to the very near term.
Accordingly, the long end is of no interest to us. The duration risk-reward trade is asymmetrical and to be avoided unless matching liabilities or not subject to mark-to-market pressures. We continue to view active managers that manage duration risk being the outperformers relative to passive funds.
At the other side of the seesaw, the short end contains little value. We view the fulcrum of the seesaw, being the three-to-six-year mark as being a buying opportunity. In the event inflation is in fact “transitory”, whilst the gains may not be as large at the duration heavy long end, the downside protection against convexity squeezes is far more palatable.
Public Credit
Turning to performing public credit, the headline is that spreads are tight and market exposure is not favoured. Instead, we look to exploit mispricing, illiquidity and/or idiosyncratic opportunities.
As evident in Figure 17, we do not see any sub-sectors standing out in terms of allocative value. Nearly all are trading at or near historic spread lows. In our analysis we look at regulatory capital post Basel III changes, to reflect structural modifications to the instruments. Notably, there is some merit to further allocation in the riskier, non-major AT1 hybrid space, noting the trading margin is sitting inside the interquartile range.
Spread Box Plots (Post Basel III for Reg Cap, pre GFC for others)
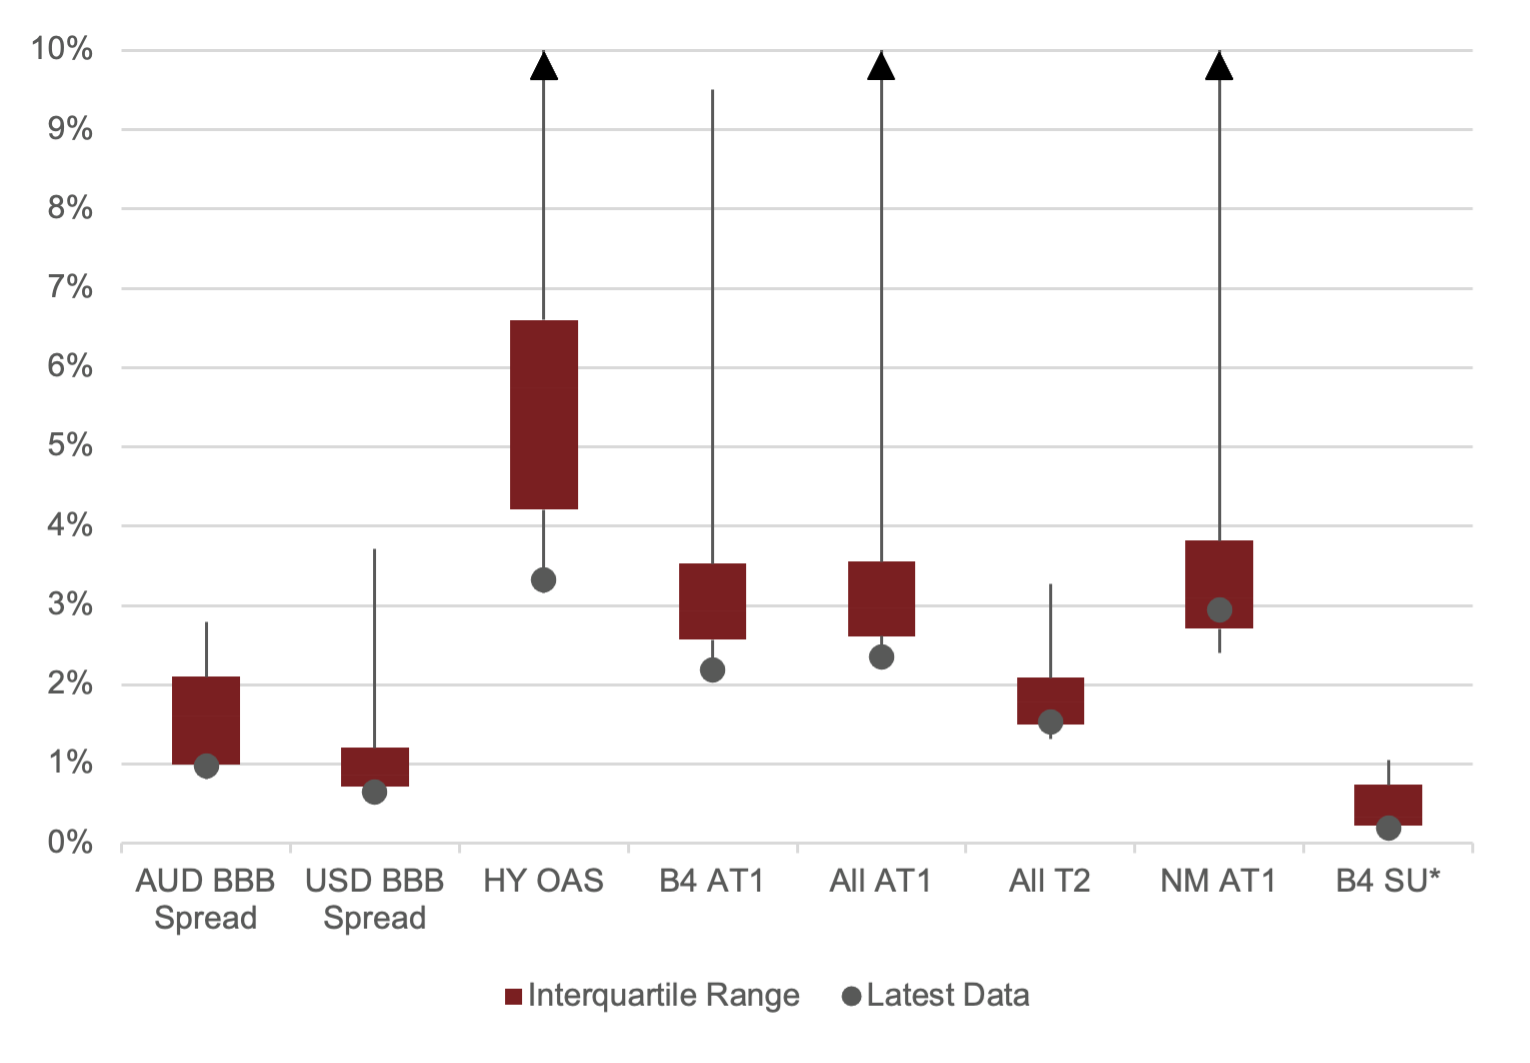
(Figure 17 – Source: BondAdviser Index Platform, Bloomberg, FRED. As at 5 May 2021. BBB based on G-spread. * Since 2015.)
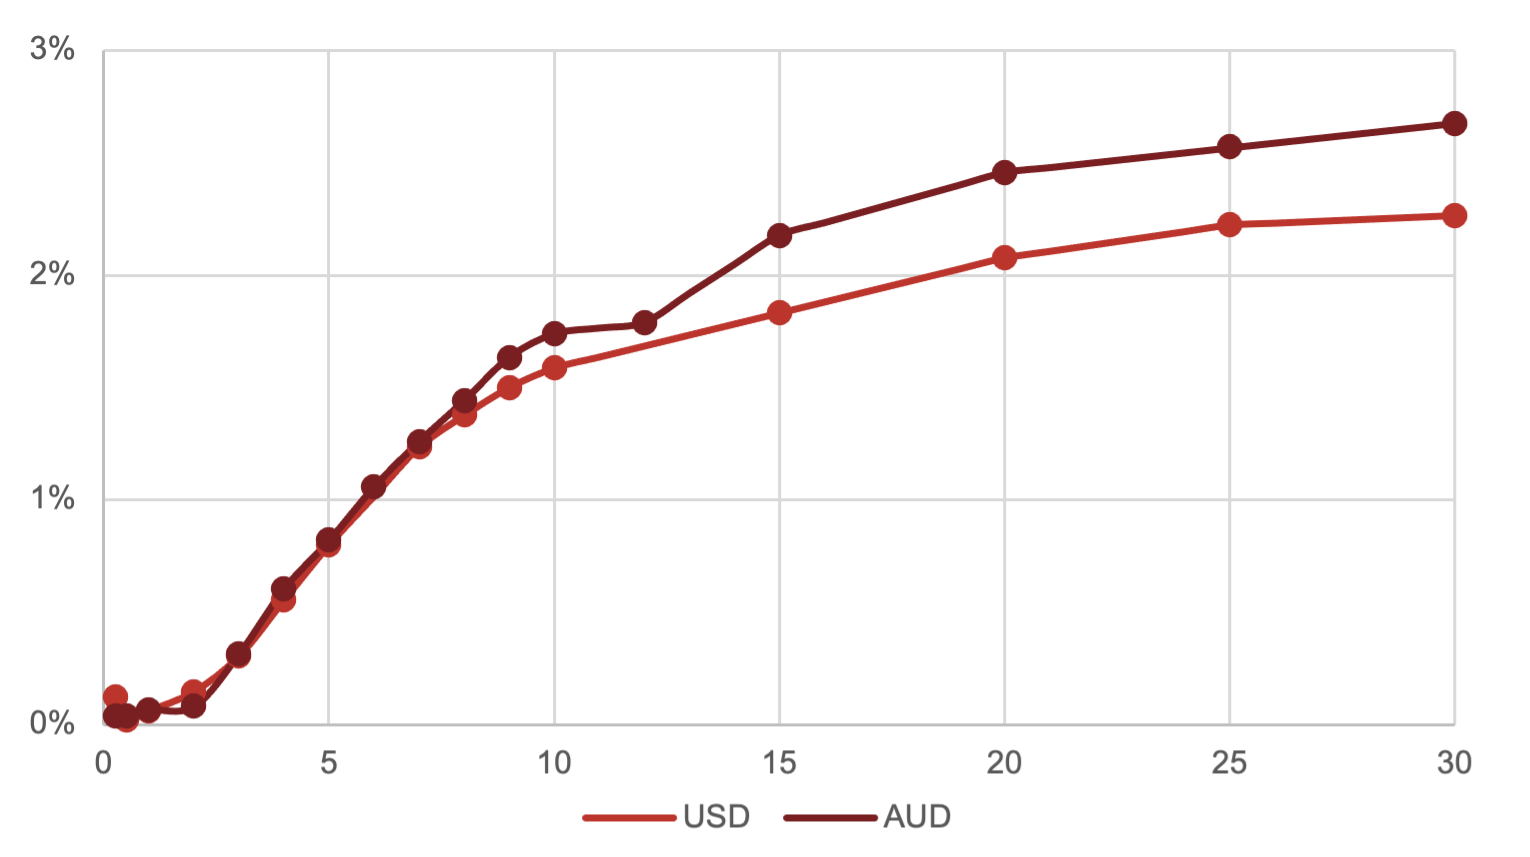
Yields have tightened considerably in the US, the 5-year G-spread for BBB securities is now a mere 65bps, whereas a year ago this was 175bps. Much of this was initially due to the near nationalisation of the investment grade credit markets from the US Fed. Subsequently it has been a ferocious hunt for yield.
This delta of the investment grade to sub-investment grade universe is now 165bps and 170bps for five- and ten-year tenors respectively. For perspective, a year ago, this was 300bps and 315bps.
USD Yield Curve – BB/BBB Delta is Getting Smaller
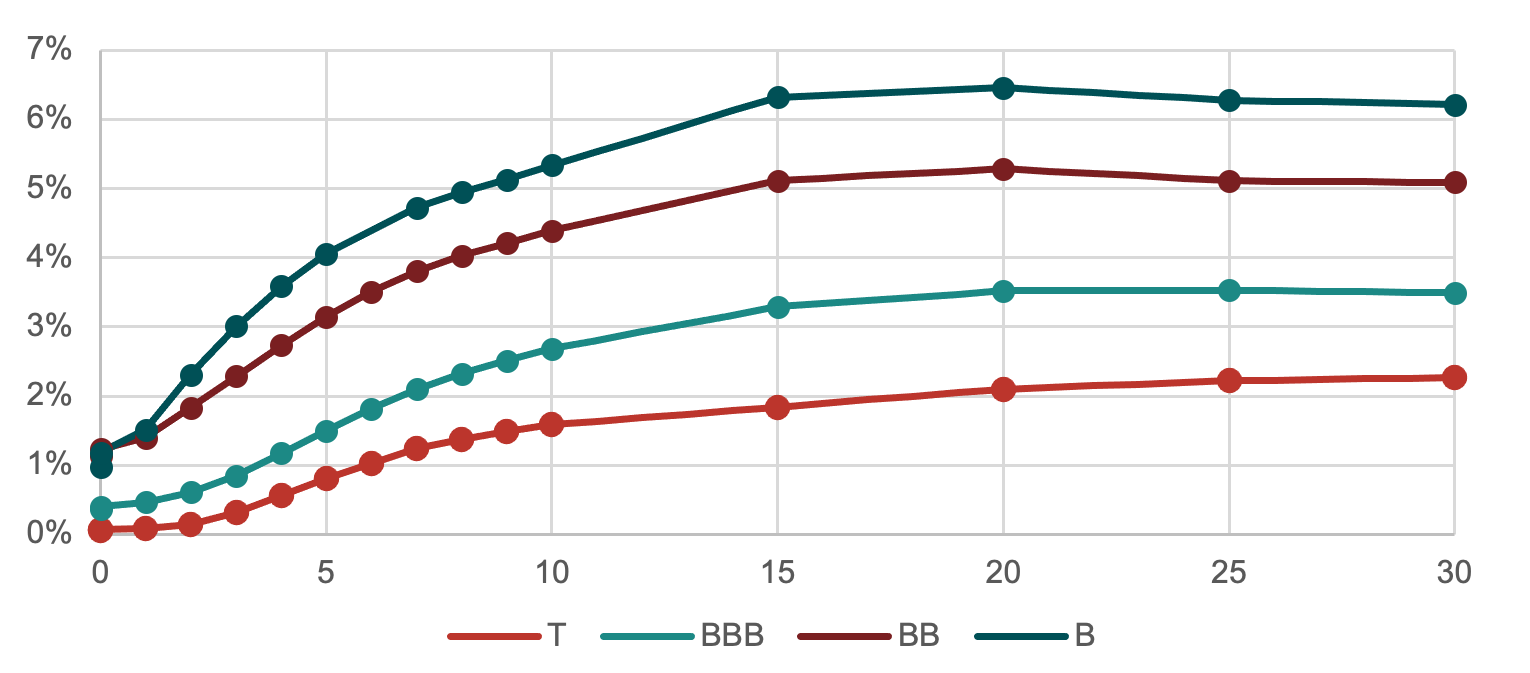
(Figure 18 – Source: BondAdviser, Bloomberg. As at 6 May 2021. )
This impact of the Fed’s backstop is best pronounced in default rates. As seen in Figure 19, 2020 investment grade defaults hardly moved from zero, whereas in the GFC this approached 1%. We expect speculative default rates to begin to mean revert across the next year, with financial conditions much more conducive for sustaining zombie companies.
Global Default Rates – Nationalisation at Work
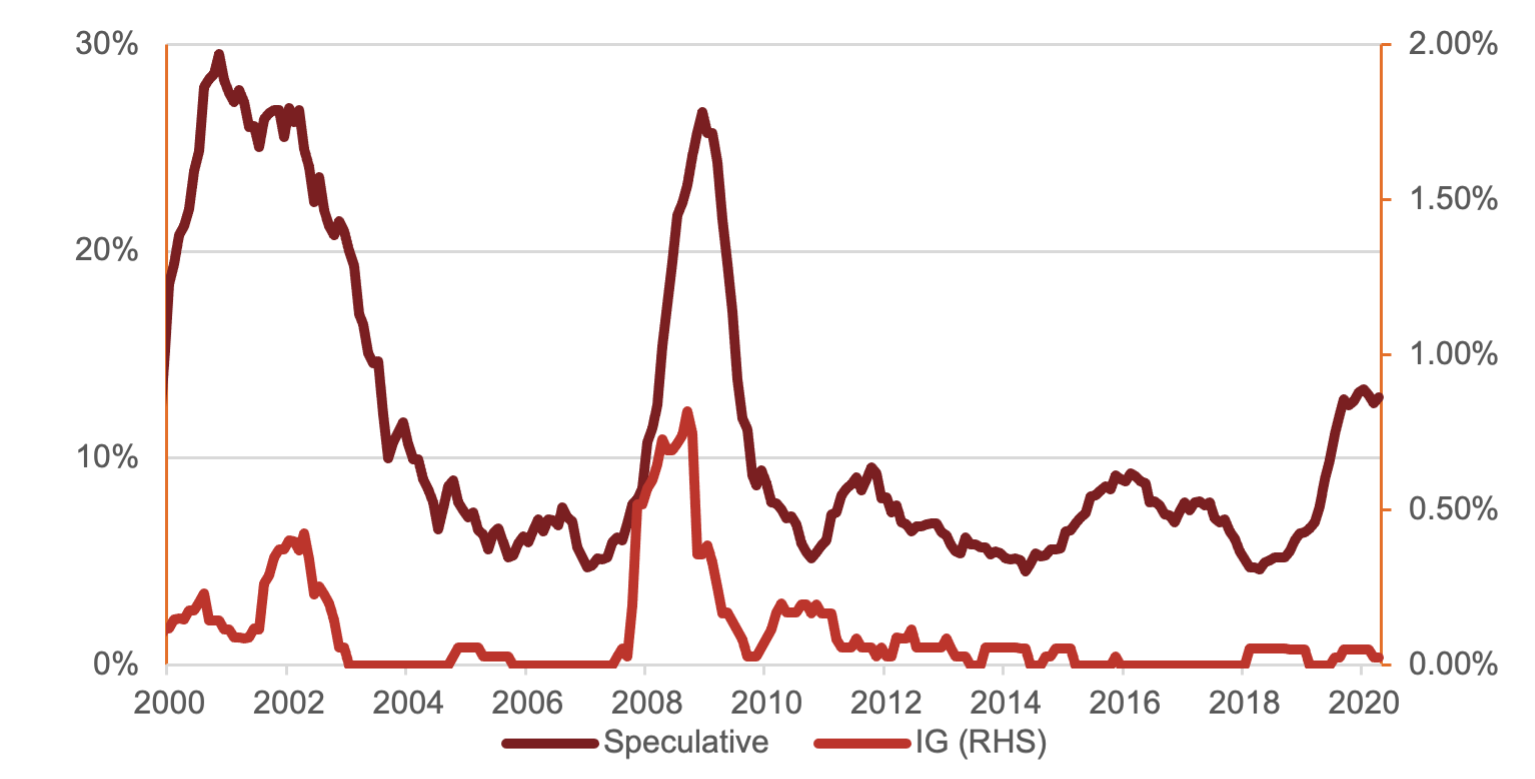
(Figure 19 – Source: BondAdviser, Moody’s. As at 5 May 2021. )
The rally of credit is just as extreme at the riskiest end, with CCC & Lower spreads now just a mere 640bps (ICE BofA). Whilst some of this can be attributed to the better ‘credits’ being part of the index, it should still illustrate the velocity of the thirst for yield.
USD High Yield Option Adjusted Spreads – Who You Calling Junk?
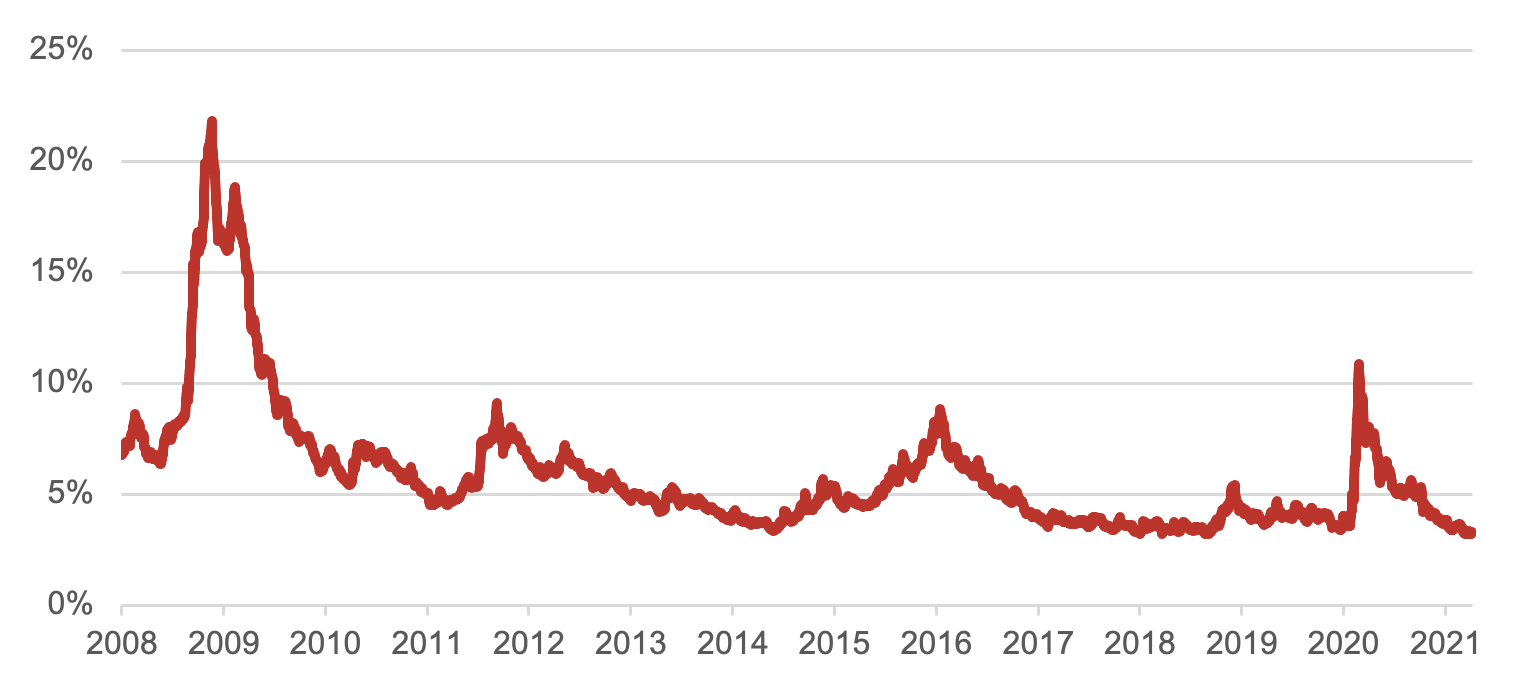
(Figure 20 – Source: BondAdviser, FRED, ICE BofA. As at 6 May 2021. )
Domestically, the BBB corporate 5 year I-spread is now 95bps, whereas a year ago this was 150bps. Whilst the RBA is yet to nationalise our investment grade credit markets, broader market participants views on default and credit quality is mirroring that of the US. However, the sub-investment grade market, being far more illiquid domestically, has not compressed nearly as much as in the US. Accordingly, there are idiosyncratic opportunities here, but detailed diligence is required.
AUD Yield Curve – Spreads Mirroring US Compression
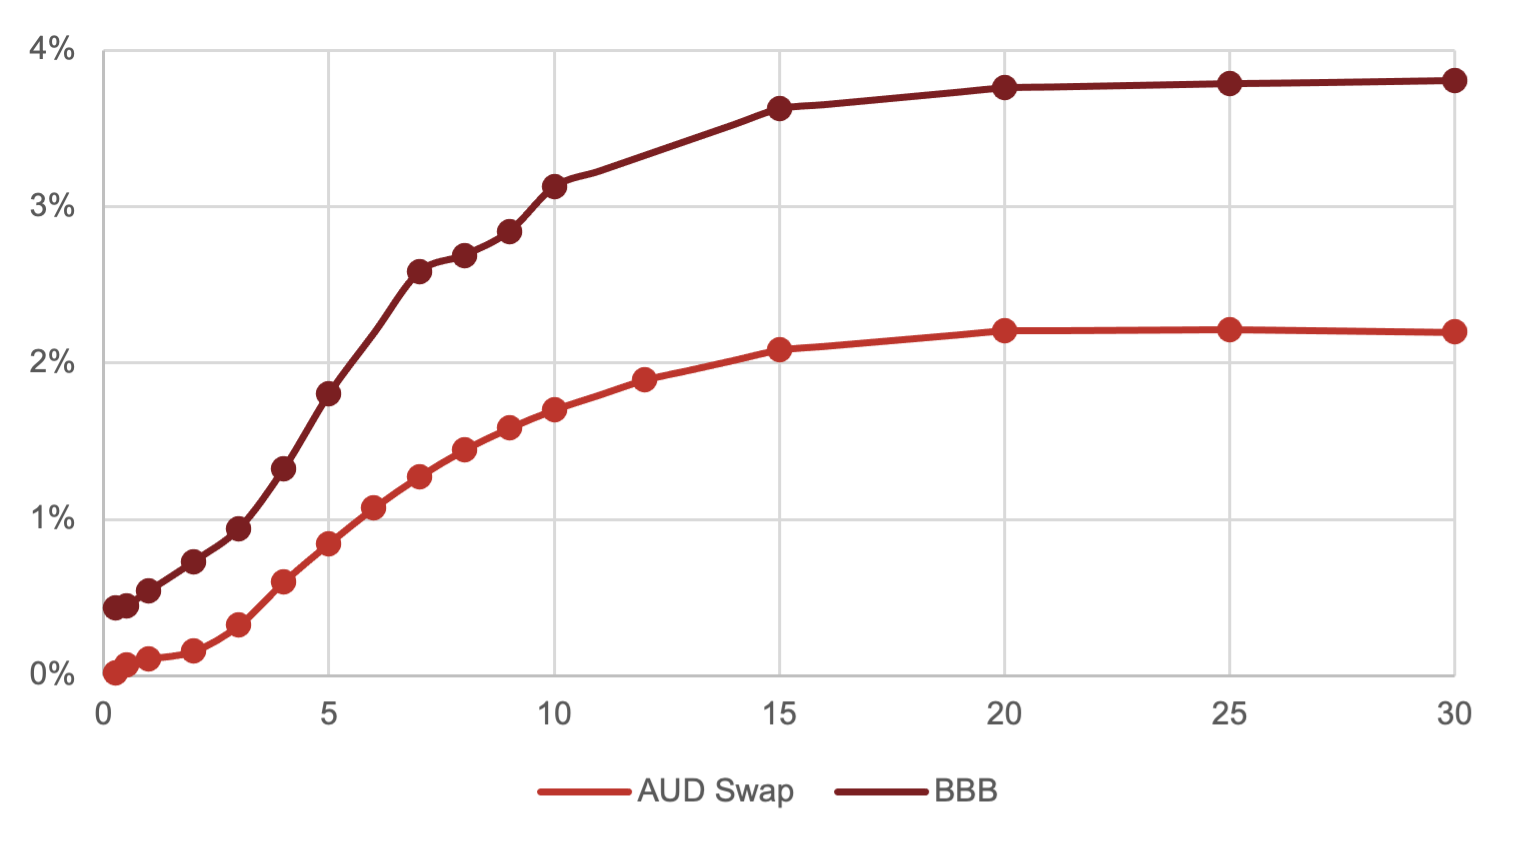
(Figure 21 – Source: BondAdviser, Bloomberg. As at 6 May 2021)
In terms of domestic supply, CY21 is on par with prior issuance averages across the past four years. This is notable given the lack of Major Bank senior unsecured paper. Corporates have taken advantage of low rates and are well ahead of the average run rate. We expect this to be a trend for 2021.
AUD Supply – Corporates
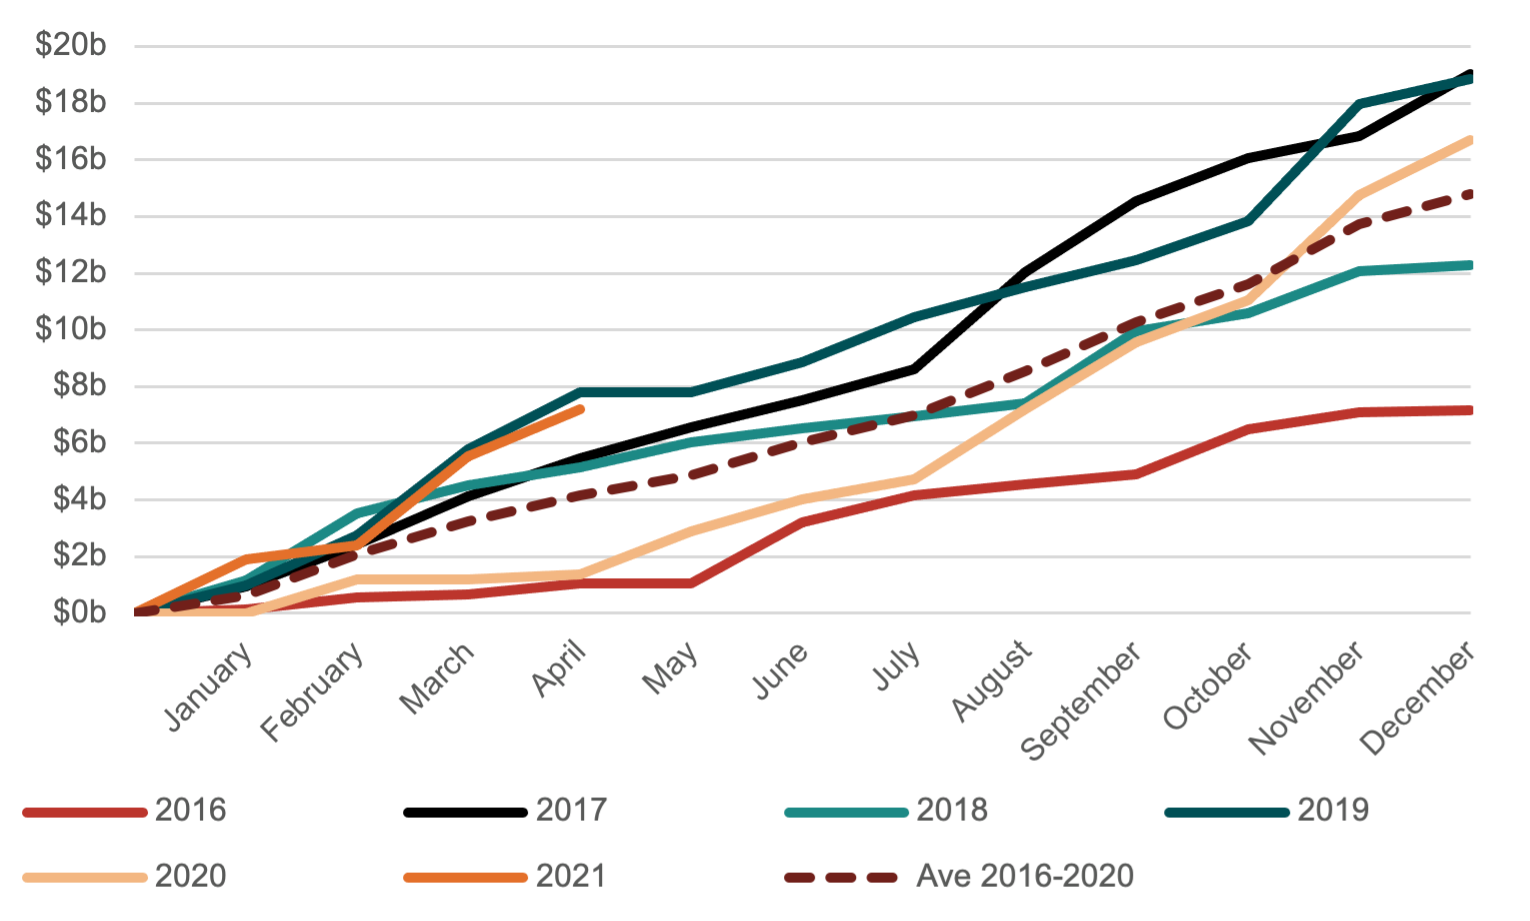
(Figure 22 – Source: BondAdviser, Bloomberg. As at 6 May 2021. Capturing ISINs beginning in AU only.)
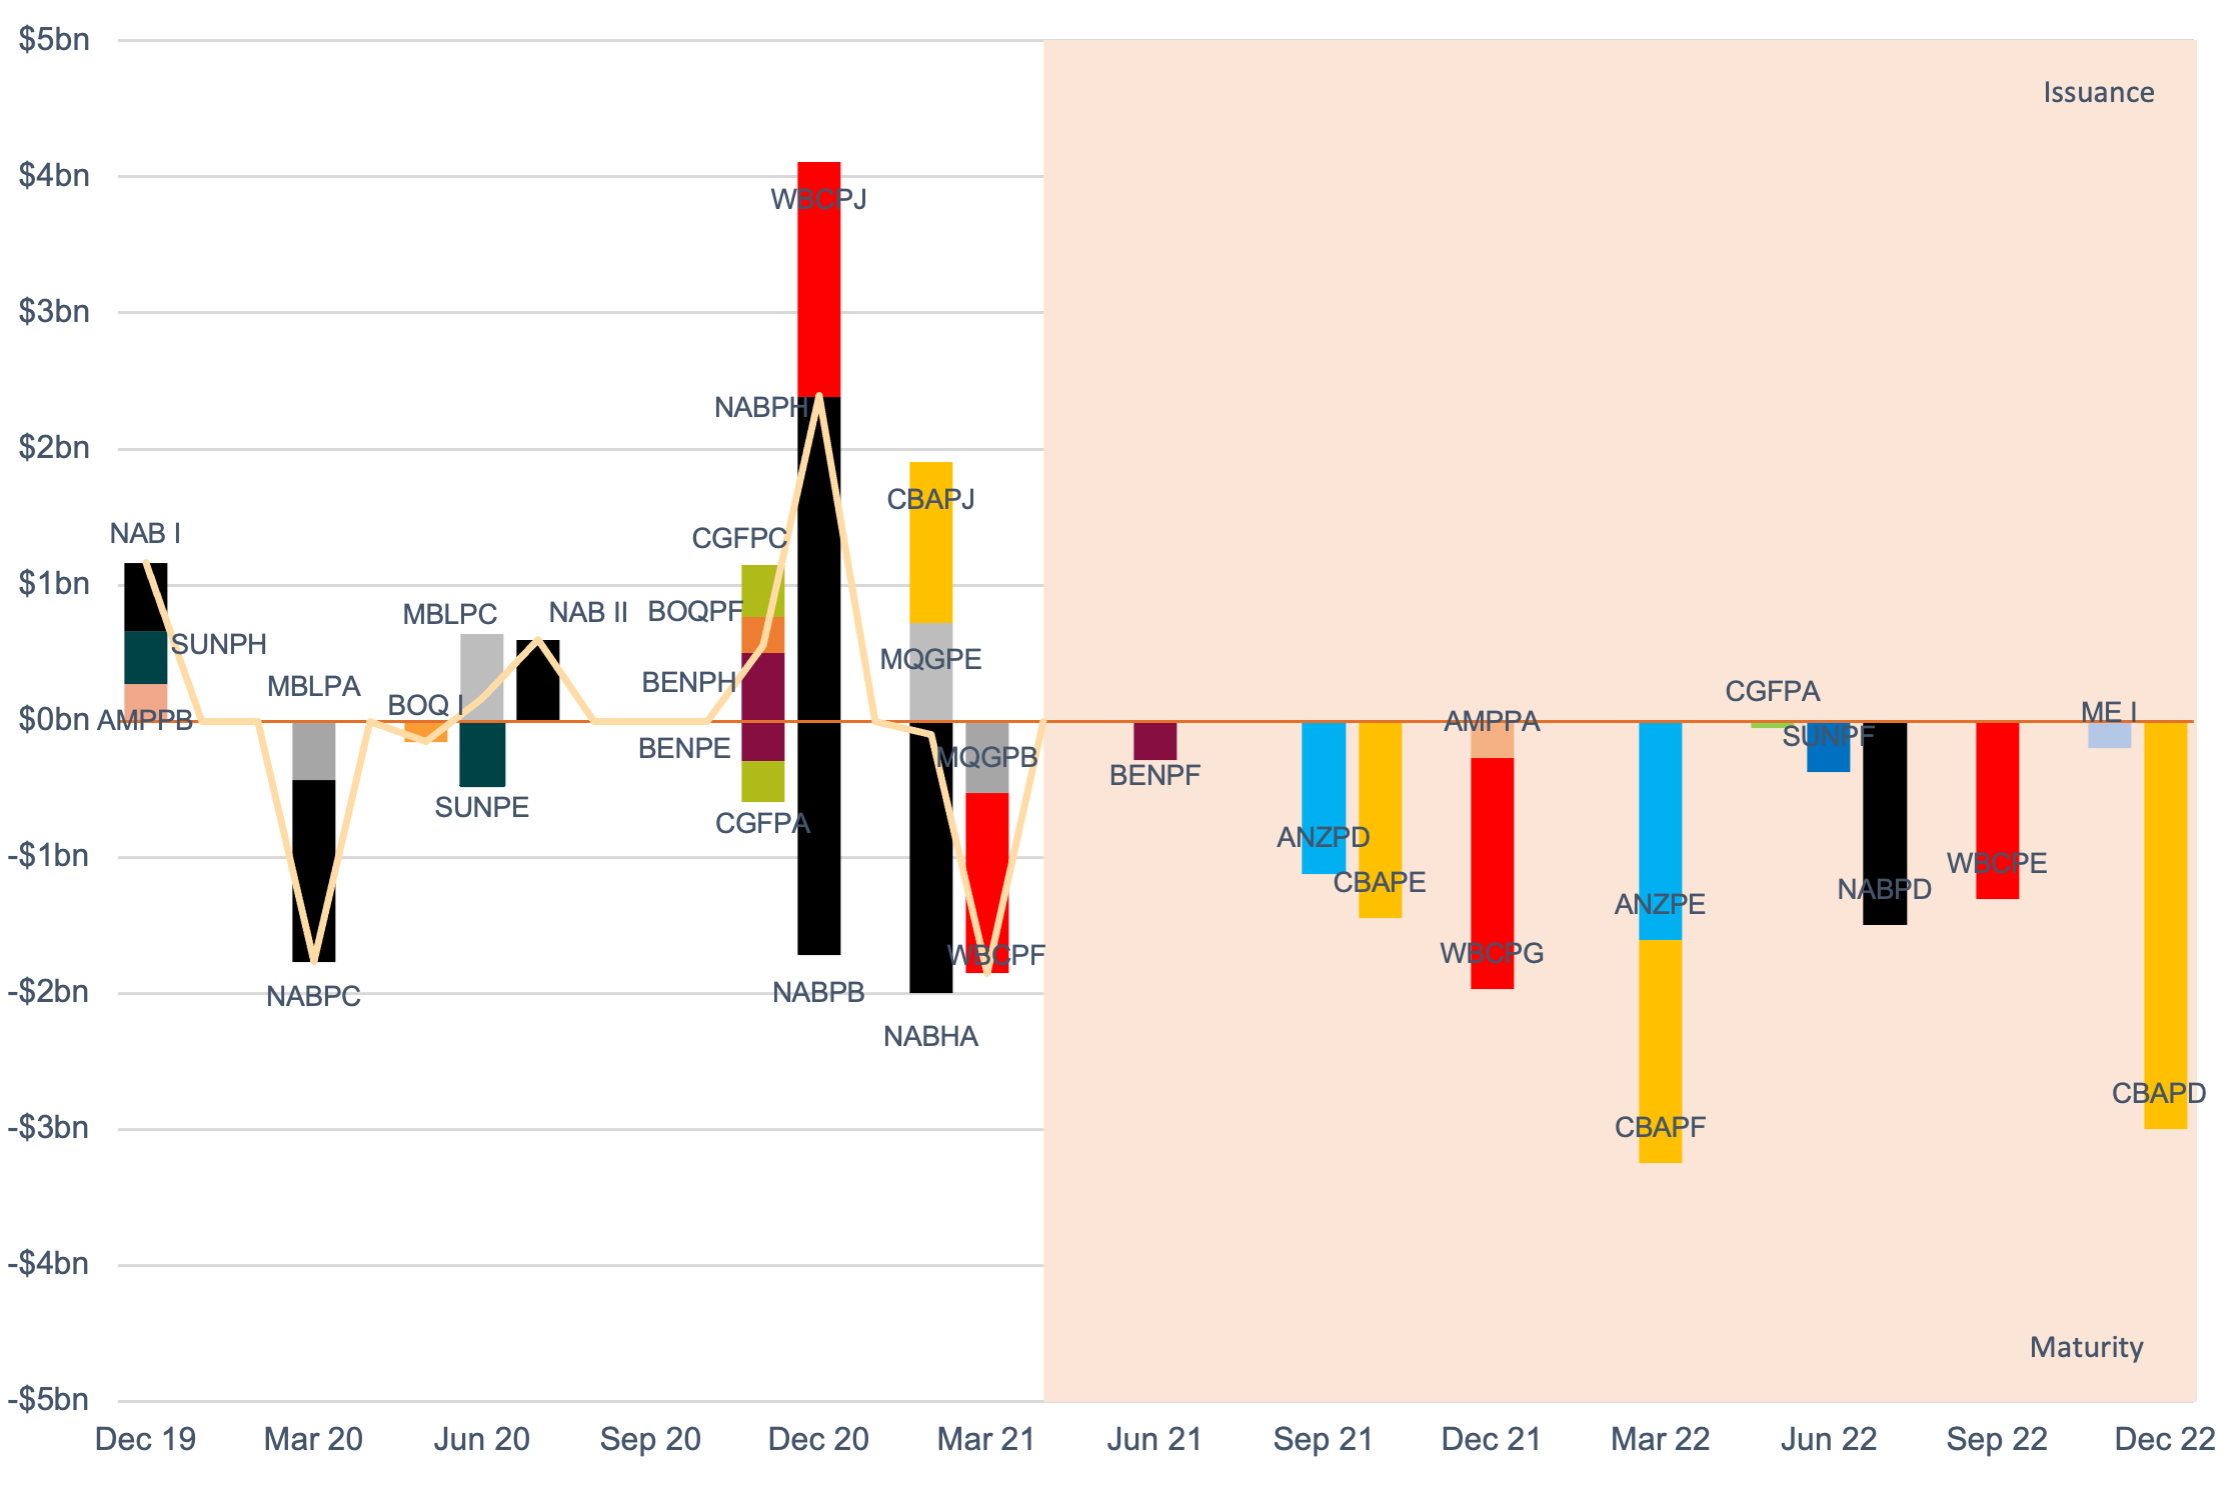
Turning to financials, the void of senior unsecured paper has been partially filled with offshore banks having seized on this opportunity; however, we think the domestic banks will begin to return to market soon. Additionally, as we discuss below, we expect domestic Tier 2 supply to also increase.
AUD Supply – Financials
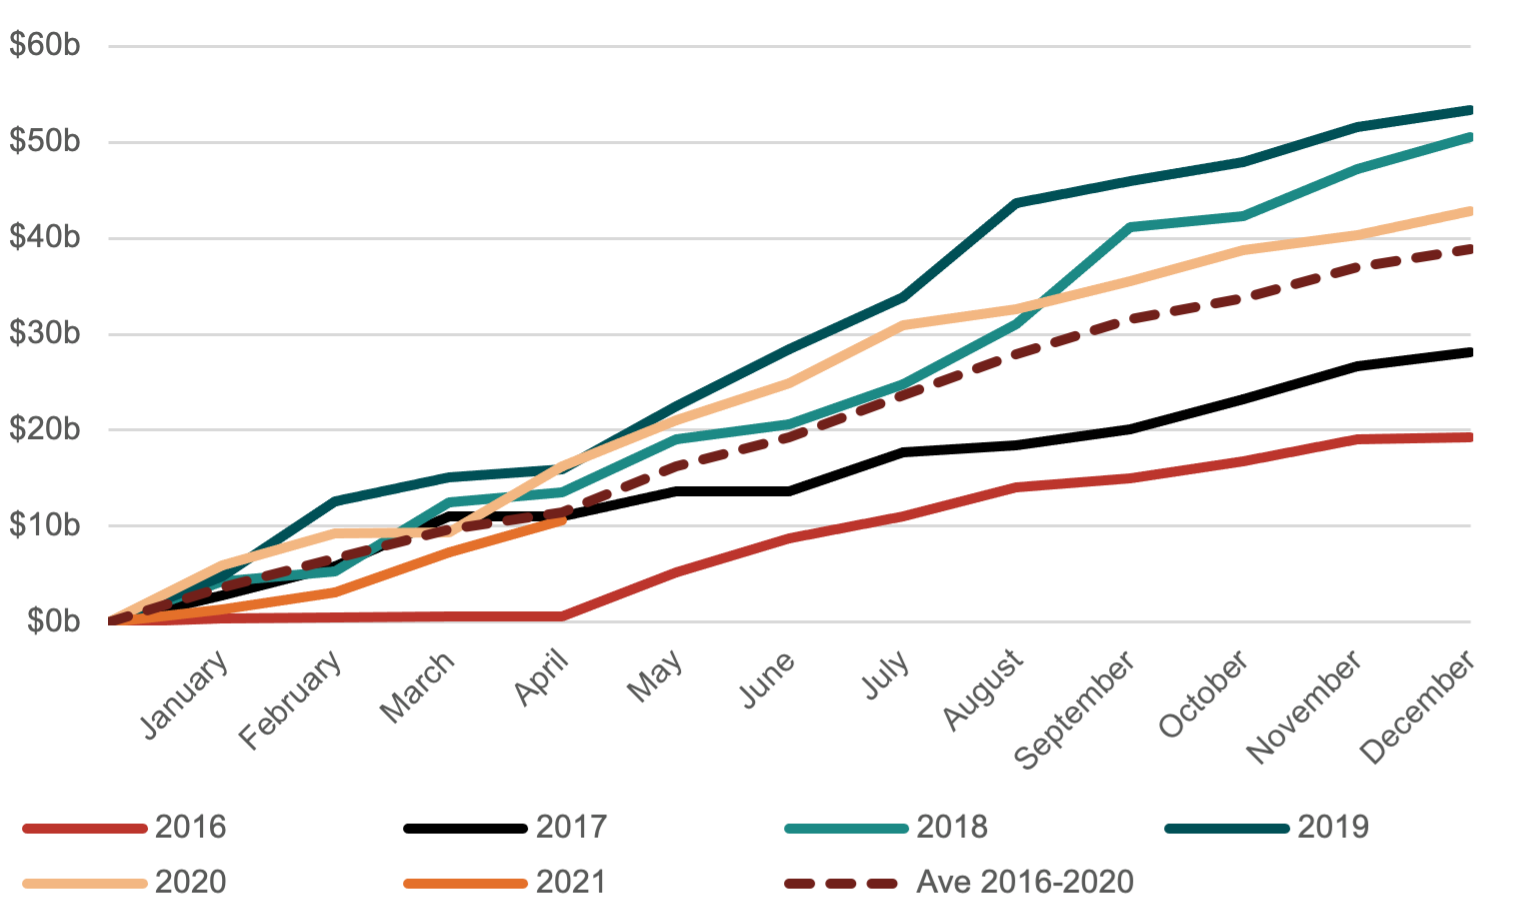
(Figure 23 – Source: BondAdviser, Bloomberg. As at 6 May 2021. Capturing ISINs beginning in AU only.)
Moving to a quick tangent; a considerable tail risk, which is difficult to price and underappreciated by markets is escalation between China and the US. We would expect new issuance to evaporate due to uncertainty and startling volatility. Whilst a hot conflict would have horrific consequences beyond that of financial markets, it would be reasonable to assume that cash would be king, with even Treasuries selling-off, like we saw in COVID, as the system scrambles to delever. We hope this never manifests.
Our base case is that we continue to expect future issuance from corporate Australia to be above average in 2021. This is on opportunistic expectations, as more corporate Treasurers opt to term out fixed rate funding. This is sensible from a cost perspective, as it takes advantage of low spreads and protects against any increase in inflation that will increase the benchmark rate. Investors should be aware of this and note swaps can be used to limit duration but take advantage of new issue premiums for quality credits.
We expect the NBN Co will return to the AUD market in CY21, given it needs to refinance a $16.5 billion Commonweath Loan (as at 31 December 2020) in FY24. In the future, outside the Major Banks, NBN Co could be the largest AUD bond issuer. We viewed the newly issued USD bonds as cheap (expensive for issuer), and whilst we think management will tap a EUR tranche, they may consider increasing the AUD supply.
The domestic high yield market has struggled to overcome COVID’s impact on market sentiment, with issuance being limited in both number and dollar volume. We have seen an increase in the use of convertibles as an alternative for funding, which for the well versed, can prove lucrative from an investor perspective due to the equity optionality.
Positively, the strength of demand both at primary and on secondary markets for certain issues suggests ample money remains willing to invest in the unrated / sub-investment grade market domestically. One such example was the Centuria Capital No. 2 Fund’s (C2F) Secured Redeemable Notes (ASX: C2FHA). We thought the issuance margin at 3mBBSW+425bps was cheap compared to alternatives and past wholesale C2F issuance. Swapping the coupon into USD resulted in an equivalent yield that was above the corporate singe B yield curve. Our opinion was that C2FHA’s security profile is superior to this and the premium was more than adequate for expected illiquidity. In 17 days since first trading, the price is now $104 (as at 5 May 2021), representing ~85bps of margin compression.
The next test we see for the unrated market will be Peet’s (ASX: PPC) listed bonds (ASX: PPCHA), which are approaching final legal maturity on 7 June 2021. We expect Peet to return to markets to refinance this $100 million, however given the success of the wholesale bond in 2019, we are unsure whether a new bond would be in a listed or unlisted format. Regardless, we expect demand to be significant, given continued performance and tailwinds to the affordable housing market.
Tacking to financials, the narrative in terms of value is similar, most parts of the capital structure are trading at near post Basel III lows.
Big Four Senior Unsecured Trading Margins – Get Underweight Now
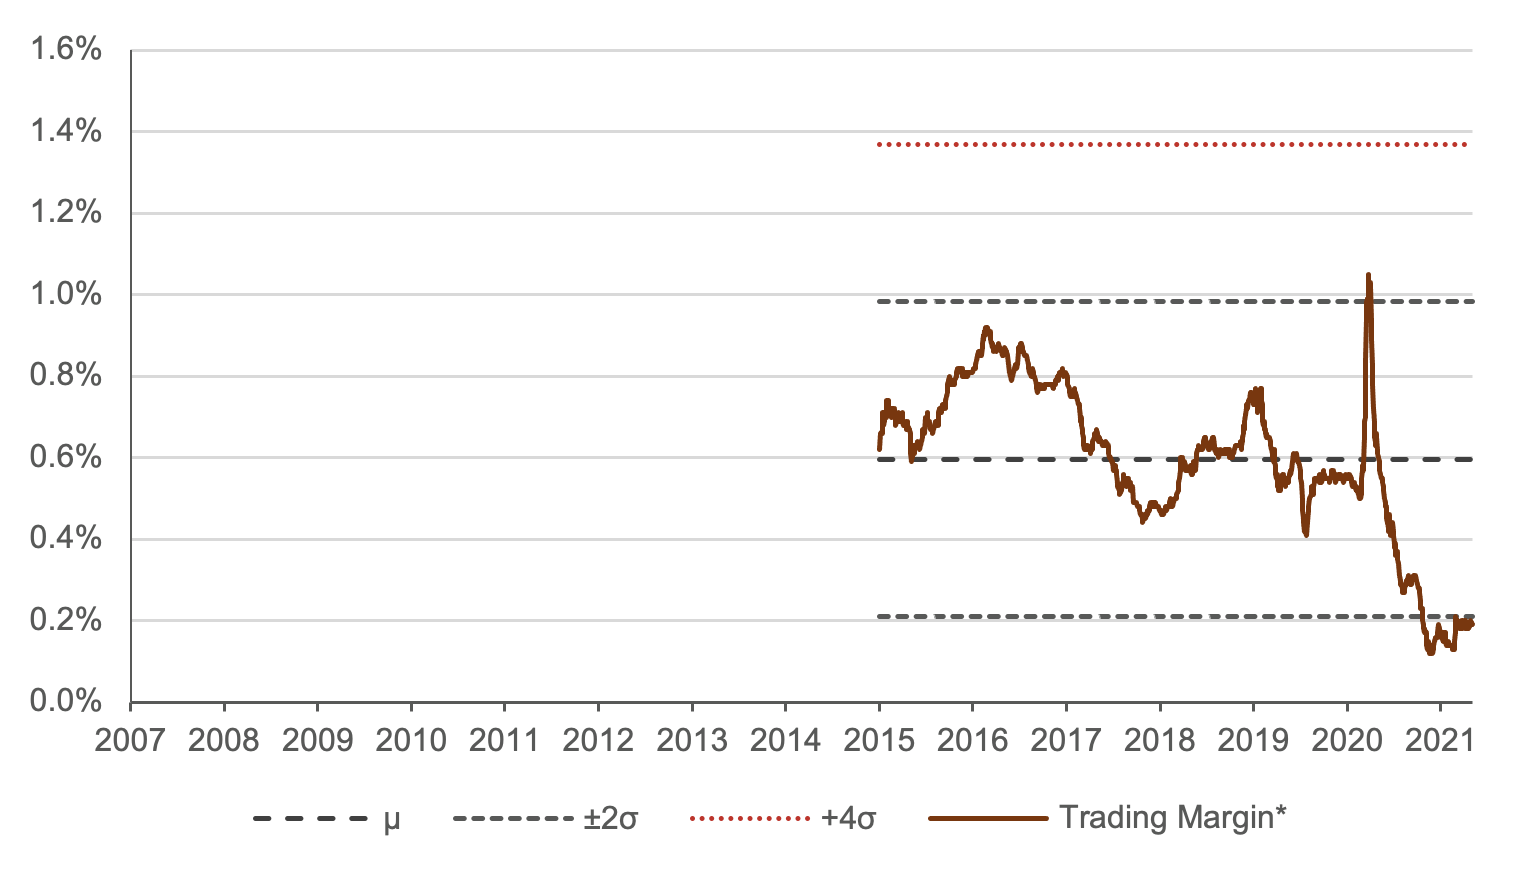
(Figure 24 – Source: BondAdviser Index Platform, BAB4SU0DNTR. As at 5 May 2021. * Trading margin based on I-spread to expected maturity.)
In May, the RBA announced it would not be considering a further extension of the term funding facility (TFF). In our opinion, the dramatic rally in senior unsecured bonds of the banks has been fuelled by a lack a supply, given banks have accessed cheaper financing in the form of the TFF. We now see the pendulum swinging in the other direction – banks will now return to the market in massive (we expect over +$160 billion) size and front to back book churn will reset pricing higher. Whilst there may be good opportunities at primary, on secondary trading we are underweight senior paper. Additionally, Big Four senior paper would not benefit from any BICRA update.
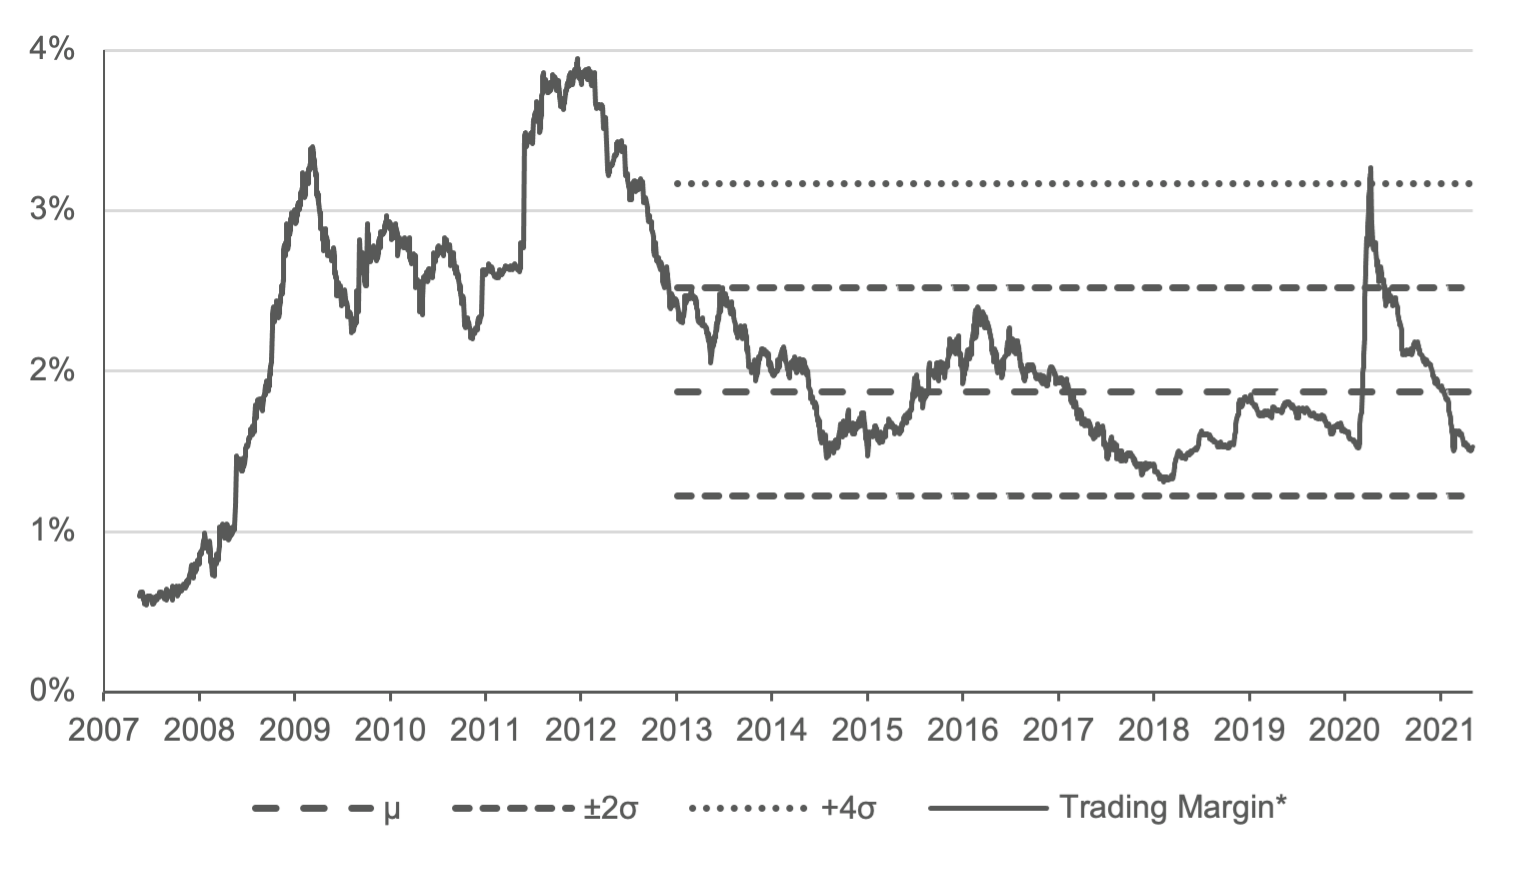
All AUD AT1 Trading Margins – BICRA will Benefit AT1
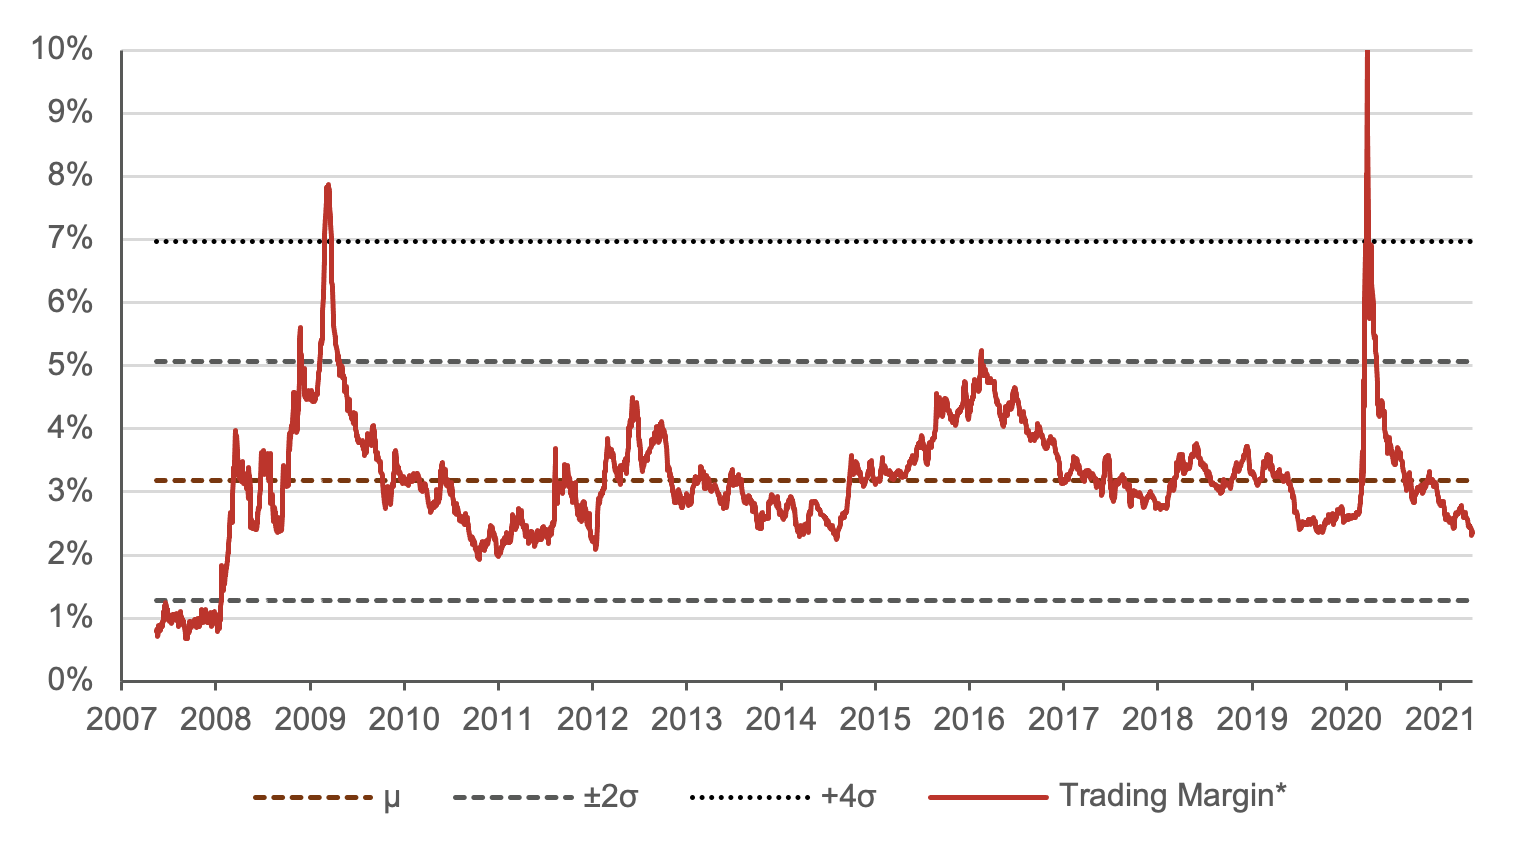
(Figure 25 – Source: BondAdviser Index Platform, BAAUAT1DFTR. As at 5 May 2020. * Trading margin based on I-spread to expected maturity. )
In April, S&P confirmed Australia’s Banking Industry Country Risk Assessment (BICRA) had moved favourably, with the Economic Risk improving from Negative to Stable and the Industry Risk improving from Stable to Positive. There is a material possibility that in the next two years, the Industry Score improves to 2 from 3. A 2 score is in line with that of Canada and Singapore. This would change the anchor rating for the domestic bank credits. It would improve from bbb+ to a-. In turn, this would improve the stand-alone credit profile (SACP) of all Australian banks by +1 notch.
Accordingly, the Big Five would see Tier 2 and AT1 ratings increase by a single notch, however the issuer credit rating (ICR) will remain unchanged. For the Big Four, this means Tier 2 and AT1 ratings would be upgraded to A- and BBB respectively. For the regionals, ratings for senior unsecured, Tier 2 and AT1 would all receive a +1 notch upgrade. Given Figure 17, we think there is some value here in the non-major space, albeit for the braver ones amongst us.
The AT1 hybrid market is generally trading rich compared to post Basel III history, however we think tailwinds remain. In addition to the possibility of a BICRA upgrade, hybrids have benefited from niche technical changes in the way APRA calculates capital ratios. Hybrids contain Capital Trigger loss absorbing events. Should capital ratios fall below specified levels, APRA or the issuer can unilaterally convert or write-off hybrid securities. The new calculations are more in line with global conventions, meaning domestic CET1 ratios will be higher and thus further away from a Capital Trigger event.
No Real Refinancing of AT1 Hybrids – Beneficial to Spreads for 4m
(Figure 26 – Source: BondAdviser Index Platform. As at 5 May 2021. )
An additional near-term benefit for hybrids is that supply is expected to be limited from a refinancing perspective. We have been advocates for relative value trading in hybrids for some time. We believe mispricing can still be found on a rich/cheap basis. This strategy has been well rewarded, and we continue to exploit it.
More generally, we continue to expect margin compression in AT1 hybrids and are now overweight. We particularly like the 1-3 year part of the curve where majority of the credit spread and term premium is present.
All AUD Tier 2 Trading Margins – Take Profit on Heavy TLAC Supply
(Figure 27 – Source: BondAdviser Index Platform, BAAUT20DNTR. As at 5 May 2021. * Trading margin based on I-spread to expected maturity. Mean and standard deviations calculated from 1 January 2013. )
The Tier 2 bond market would also benefit from a BICRA uplift. We have been overweight Tier 2 since June 2020 and doubled down in October 2020. We have now moderated this position to a more neutral weighting. Additional supply in Tier 2 due to TLAC requirements may finally come home to roost and we are happy to take some profits here. Additionally, there is the blurred lines problem that we first alluded to in July 2019, where APRA stated on record that it “does not consider there would likely be any difference between the point of non-viability and resolution”. Our interpretation of this is that Tier 2, like AT1 hybrids, will be treated as going concern capital. So, it could be written off before insolvency. This is far different to the gone concern assumption used globally, where Tier 2 bonds only convert near or after AT1 capital. The relative positive carry on AT1 hybrids here means that without an obvious value proposition, we are replacing our Tier 2 tilt for an AT1 tilt.
Appendix 1: LTM AUD Issuance
Select AUD High Yield / Hybrids Issuance LTM
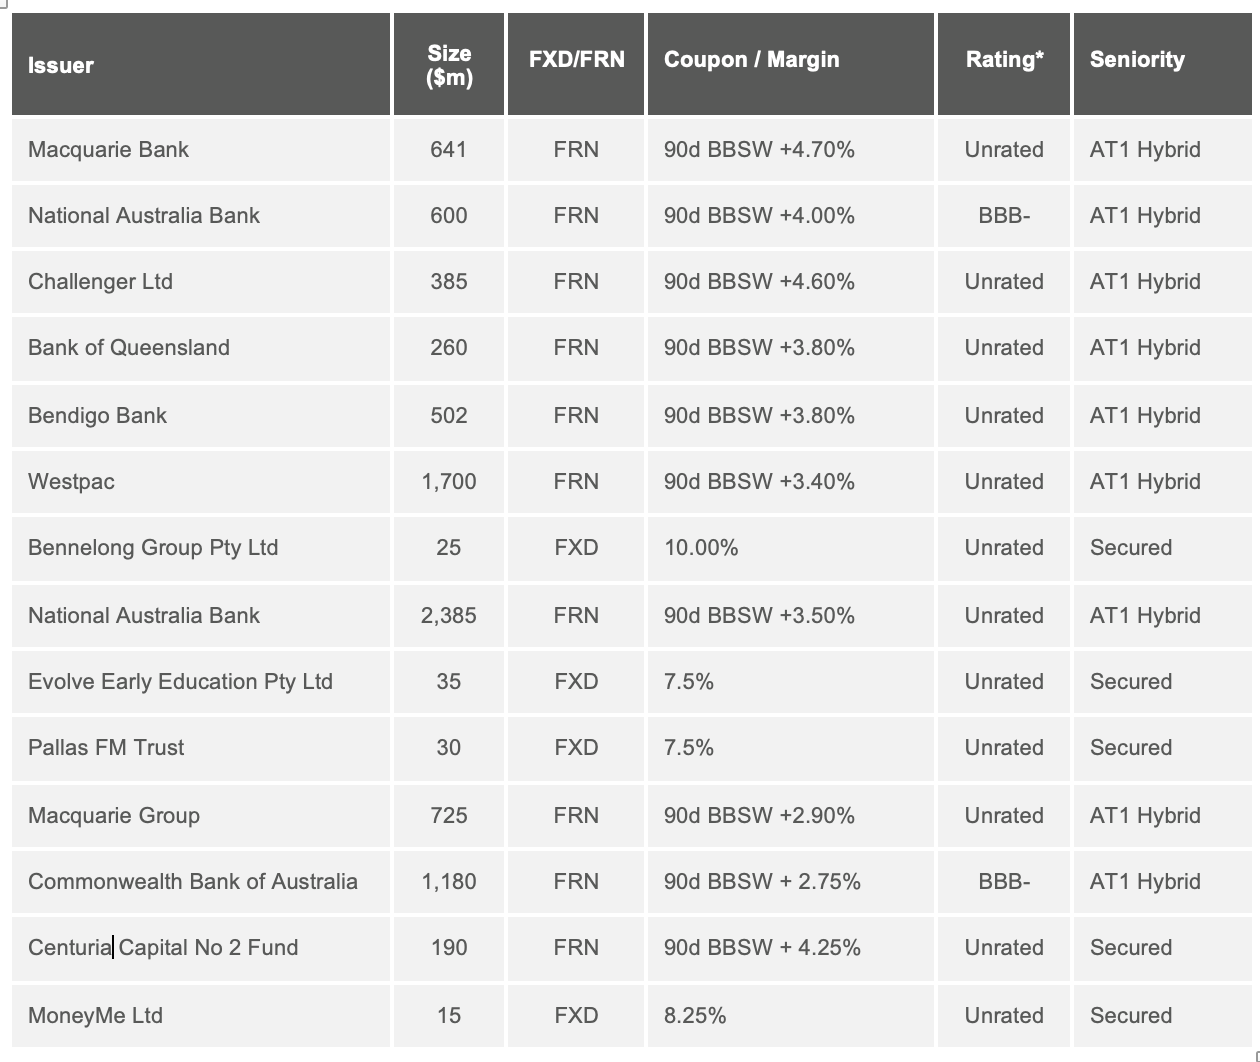
(Figure 28 – Source: BondAdviser, Bloomberg. * Security rating, not issuer credit rating.)
Select AUD Non-Financial IG Issuance LTM
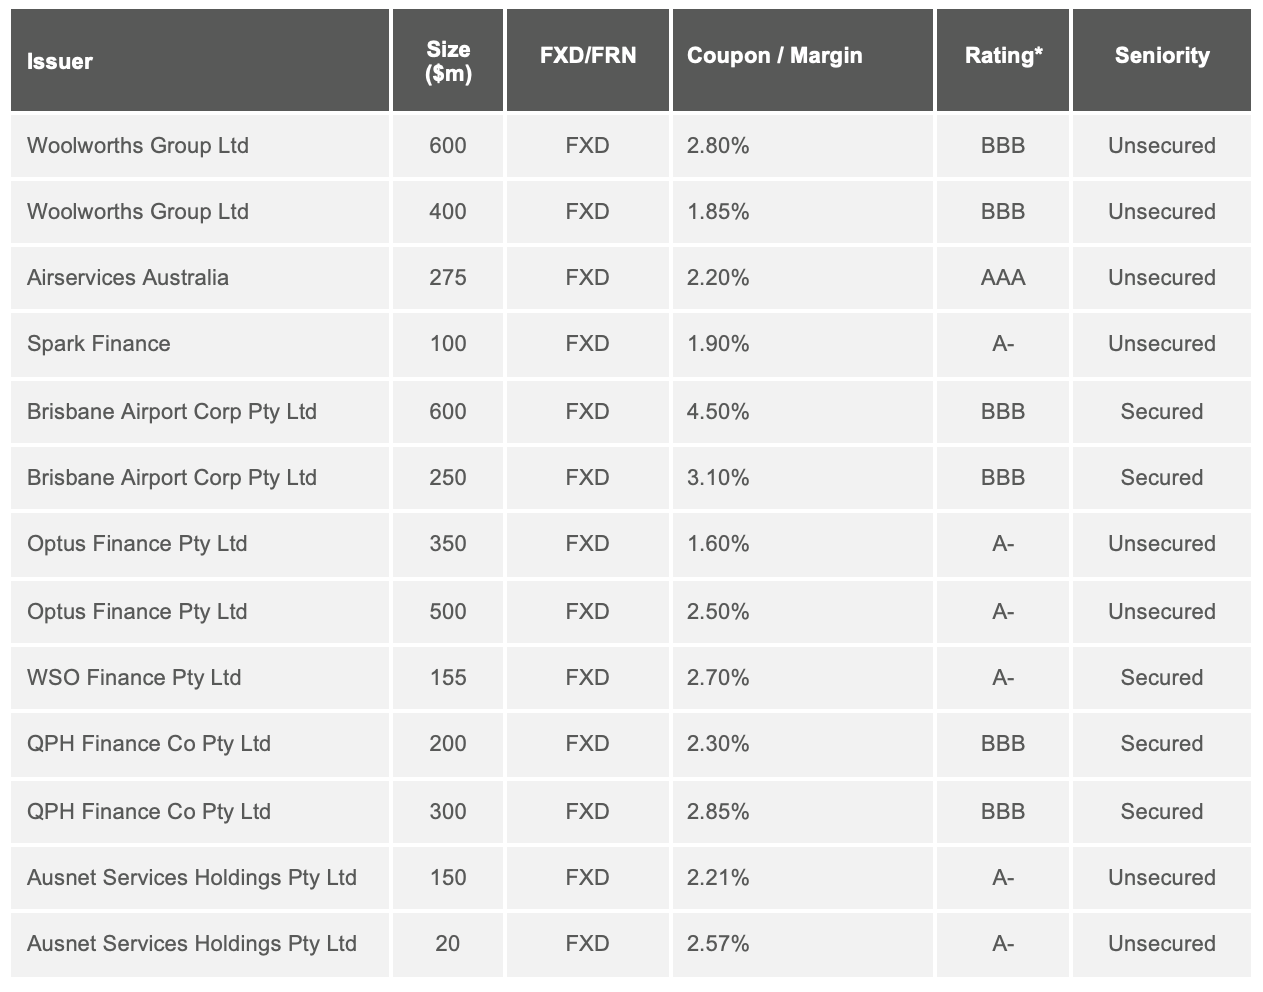
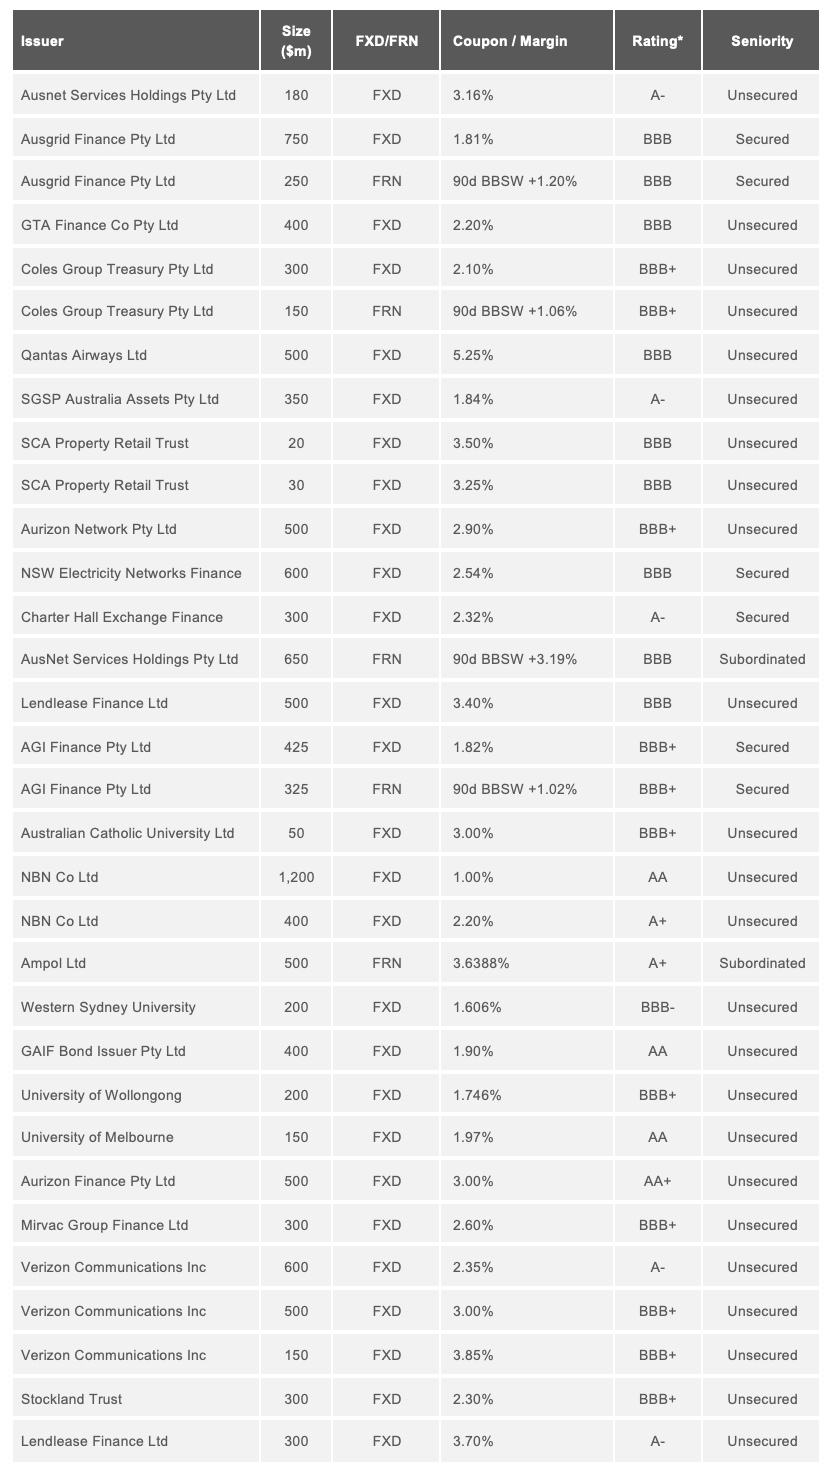 (Figure 29 – Source: BondAdviser, Bloomberg. * Moody’s rating or Moody’s comparable. )
Author/s: Charlie Callan, Ben Haseler, George Osti
Responsible Manager: John Likos
General Disclosures
BondAdviser has acted on information provided to it and our research is subject to change based on legal offering documents. This research is for informational purposes only.
This information discusses general market activity, industry or sector trends, or other broad-based economic, market or political conditions and should not be construed as research or investment advice.
The content of this report is not intended to provide financial product advice and must not be relied upon as such. The Content and the Reports are not and shall not be construed as financial product advice. The statements and/or recommendations on this web application, the Content and/or the Reports are our opinions only. We do not express any opinion on the future or expected value of any Security and do not explicitly or implicitly recommend or suggest an investment strategy of any kind.
The content and reports provided have been prepared based on available data to which we have access. Neither the accuracy of that data nor the methodology used to produce the report can be guaranteed or warranted. Some of the research used to create the content is based on past performance. Past performance is not an indicator of future performance. We have taken all reasonable steps to ensure that any opinion or recommendation is based on reasonable grounds. The data generated by the research is based on methodology that has limitations; and some of the information in the reports is based on information from third parties.
We do not guarantee the currency of the report. If you would like to assess the currency, you should compare the reports with more recent characteristics and performance of the assets mentioned within it. You acknowledge that investment can give rise to substantial risk and a product mentioned in the reports may not be suitable to you.
You should obtain independent advice specific to your circumstances, make your own enquiries and satisfy yourself before you make any investment decisions or use the report for any purpose. This report provides general information only. There has been no regard whatsoever to your own personal or business needs, your individual circumstances, your own financial position or investment objectives in preparing the information.
We do not accept responsibility for any loss or damage, however caused (including through negligence), which you may directly or indirectly suffer in connection with your use of this report, nor do we accept any responsibility for any such loss arising out of your use of, or reliance on, information contained on or accessed through this report.
© 2021 Bond Adviser Pty Ltd. All rights reserved.