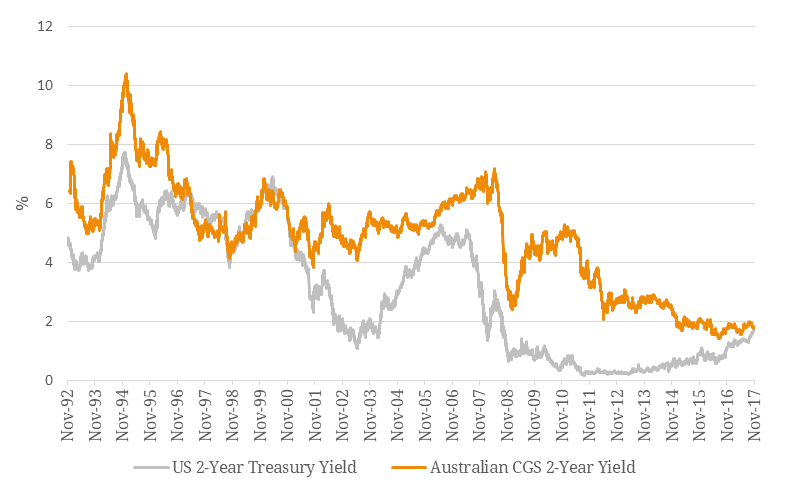
In a quiet, yet potentially revealing fashion, an event not seen in the fixed income world for almost 20 years happened this week when US and Australian two-year government bond yields touched at around 1.75% on 28 November 2017. The explanation for this convergence is relatively simple: the Fed ultimately remains on track to raise rates in December and into 2018. The UK just has and the ECB is also likely to raise its policy rate next year, whereas recent RBA minutes and a speech from the governor last week indicated a non-existent case for a similar move here. The US and EU have had a long period of monetary stimulus and their economies are expected to improve. On the other hand, we have seen weak inflation numbers and another disappointing wage-growth outcome in Australia. Looking at the yield convergence alone, it paints a picture of relative economic underperformance in Australia to the US – the last time the two-year Aussie yield was below its American counterpart was in the late 1990s when the US economy was powering full steam ahead during the tech boom (Figure 1), albeit the bust was to come in the early 2000’s. Figure 1. Australian 2-Year Government Bond Yield vs US 2-Year Government Bond Yield  Source: BondAdviser, Bloomberg Does the longer end of the yield curve, as represented by 10-year government bond yields, which are widely believed to better reflect economic growth rates, tell the same story? As at 28 November 2017, US 10-year yield was 2.33% and the Australian equivalent was at 2.50%, a very narrow gap of just 17 bps (Figure 2). If these yields converge too, it would represent an even gloomier outlook for Australia’s longer term economic growth prospects. But will this actually happen? Figure 2. Australian 10-Year Government Bond Yield vs US 10-Year Government Bond Yield
  Source: BondAdviser, Bloomberg On the Australian side, employment has grown for 12 consecutive months, the longest uninterrupted streak since 1994. A weaker AUD is also generally positive for the exporting (including inbound tourism) economy. On the US side, structural changes such as rising digitalization, automation and higher productivity may curtail longer-term inflation. In addition, interests from foreign investors to long-term US treasuries remain strong, which are expected to keep sharp yield increases at bay. All things considered and despite the wafer-thin current differential, we are more of the opinion that a 10-year convergence is unlikely and expect some positivity domestically in the near future. It is indeed possible that this could occur from the US front as well with the yield curve flattening further (figure 3). Figure 3. Australian Government Yields vs US Government Bond Yields
  Source: BondAdviser, Bloomberg That said, we’re probably at the riskiest point for a while on convergence and a few more lacklustre quarters in Australia with one or two US rate rises would be enough to prompt this outcome. Does convergence matter? Probably only to technical analysts or astrologers. Fundamentally, as opposed to what the Australian or US yield curves might tell us, by far the most concerning economic data around now is the high Australian household debt to disposable income ratio. This stands at nearly 200%, making it one of the highest in the world. For reference, and noting the markedly different background inflation and interest rate environment, in the last Australian recession, the same ratio stood at just 75%. Should the local housing market reverse, we feel this would severely limit the RBA’s hand in raising interest rates for a long time, meaning that the above 10-year occurrence would become almost certain, but this is not our base case.
An employee-owned financial services provider focused on the Debt Capital Markets.
© Bond Adviser Pty Ltd ‧ ASFL 456783 ‧ ABN 31 164 148 467 ‧ Important Information
This site is protected by reCAPTCHA and the Google Privacy Policy and Terms of Service apply.
© Bond Adviser Pty Ltd ‧ ASFL 456783
ABN 31 164 148 467 ‧ Important Information
This site is protected by reCAPTCHA and the Google Privacy Policy and Terms of Service apply.