
A key concept in all finance is the time value of money. Investors are generally increasingly compensated for lending their money for longer periods of time (assuming same inherent credit risk) with higher returns as demonstrated above in figure 1 below. Figure 1. Australian Swap Curves – Beginning & End 2018 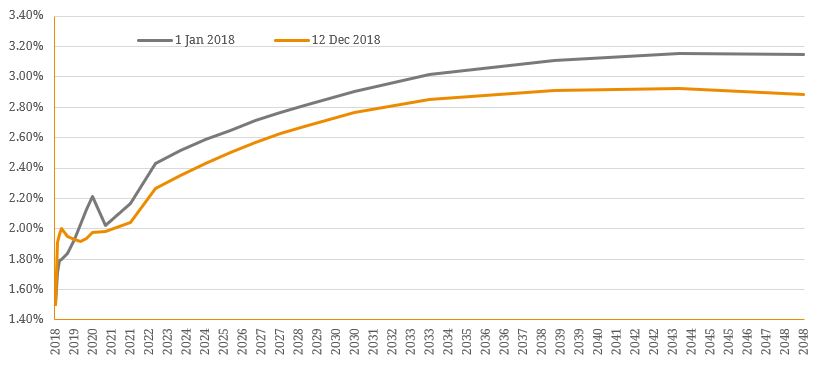 Source: BondAdviser, Bloomberg However, on rare occasions these yield curves can invert, where the spread on longer-tenor instruments or contracts drifts below those available for shorter-dated options. On paper, this violates the traditional time value of money assumption in finance. The spread between the 10-year and 2-year U.S Treasury yields (10-2 spread) is seen as a historically accurate predictor of recessions, having inverted before every recession in history, albeit the time-to-recession post inversion has varied and not every inversion resulted in a recession. Figure 2 below shows the steady decline in, and subsequent inversion of, the 5-3 spread in recent years as the US rate cycle has arguably reached its peak. Figure 2: 5-Year vs. 3-Year US Treasury Yields
  Source: BondAdviser, Bloomberg Treasury rates generally move inversely to investor confidence in the economy. When the economy is booming, investors are less risk-averse and feel more comfortable investing their capital in riskier assets and therefore yields on Treasury bonds increase as holdings are sold and the required yield increases. However, when confidence in the economy and capital markets begins to dwindle, investors seek to increase their portfolio allocation to safer assets such as US Treasuries. A very interesting player in the current inversion is the Federal Reserve (the Fed). The central bank has continued to raise rates throughout 2018 as it begins its own version of monetary policy normalization which has caused an increase on the short-end of the curve (2-year) whilst the 10-year yield has declined amid higher demand for 10-year Treasuries and some longer-term fears. This demand is a function of many factors, not least of which is perceived higher roll and reinvestment risk on shorter-dated securities and an increase in defensive asset allocation to offset a predicted equity market slide. Ultimately, the mechanics of bond mathematics sees the price of 10-year Treasuries increase from higher demand which causes yields to fall, and as the 2-year yield concurrently increases, spreads can potentially tighten to the point of inversion. However, despite consistent declines, the 10-2 spread has steadied throughout 2018 (figure 3). Figure 3. 10Y vs. 2Y US Treasury Yields
  Source: BondAdviser, Bloomberg It is important to note that this is a correlation, not causation. Bond yields do not drive recessions, but rather broad market sentiment is reflected in capital flows and provide an indication of where investors believe the economy is heading and basic economics can paint a more granular picture for investors. For example, if the economy looks as though it is slowing, confidence decreases, and investors are less willing to commit capital to longer-term projects. Without access to this capital, consumption and investment levels decline which causes a decline in GDP, which in turn, can bring about the beginning of a recession. Whilst a yield curve inversion can have many implications, the recent inversion of the 5-3 spread does not mean that a recession is imminent. Indeed, despite the 10-2 being a historical leading indicator, it is by no means an iron-clad implication of the inversion. So, before one allocates 100% of one’s portfolio to Australian government bonds or US Treasuries, it is worth considering how much of the media hype and market volatility is just ‘white noise’ and remember to invest based on fundamentals, and not mere market speculation.
An employee-owned financial services provider focused on the Debt Capital Markets.
© Bond Adviser Pty Ltd ‧ ASFL 456783 ‧ ABN 31 164 148 467 ‧ Important Information
This site is protected by reCAPTCHA and the Google Privacy Policy and Terms of Service apply.
© Bond Adviser Pty Ltd ‧ ASFL 456783
ABN 31 164 148 467 ‧ Important Information
This site is protected by reCAPTCHA and the Google Privacy Policy and Terms of Service apply.