With the US-China “trade war” fears fading away, the month of May 2018 became mostly a month of tit-for-tats between the US and North Korea with the possibility of a summit remaining quite high. US 10-year yields in response, dropped back below the important 3% level at the end of the month and credit fundamentals remain solid. The domestic market continues to see the Royal Commission examining Australian banks’ SME and Franchise loan sectors. Tighter lending criteria will likely be put in place going forward as yet more misconduct is revealed. The domestic housing market saw the eight capital cities’ dwelling prices fall 0.3% (in average weighted terms) in the month, marking the sixth monthly fall in a row but not many commentators are pressing the panic button yet. In June’s meeting, the RBA again held the official cash rate unchanged at 1.50% (20 months in a row) and we note the increasing possibility of a rate hike in the medium term with inflation and employment rebounding. During the period, the swap curve saw all tenors broadly drift upwards but with Term Deposit (TD) offerings remaining unchanged, there was a tightening in the TD spread over BBSW. Figure 1. Term Deposit Spread Over Relevant BBSW: May 2018 vs April 2018  Source: BondAdviser, RBA The Rising US Interest-rate Environment On 22 March 2018, the Fed lifted US interest rates from 1.50% to 1.75%, echoing the US Government’s growing confidence in economic growth on the back of the republican tax reform and increased government spending, but this did not have a material effect on market as this move was already priced in. Notably though, this 0.25% uplift placed the Fed funds rate ahead of the domestic cash rate (1.50%) for the first time in 18 years, arguably heralding that the differential between Australian and US rates will enter a prolonged negative era (Figure 2). Figure 2. Historical Fed rate vs Australian cash rate (since 2010)
  Source: Bloomberg, BondAdviser In comparison to US, the domestic regulator “RBA” has consistently retained a low rate with the belief that the Australian economy is not yet sufficiently recovered to absorb rate increases. Such a divergence in interest rate policies will result in both adverse and beneficial impacts on Australia. Figure 3. AUD/USD Exchange Rate Since 2010
  Source: Bloomberg, BondAdviser From a trade perspective, US dollars, as the most widely-adopted currency worldwide, could export volatility to other economies including Australia. That is to say, the strengthening US dollar, vindicated by a tightening Federal Reserve could result in a decline in US export activities due to higher costs (for oversea importers), but conversely boost demand for overseas (native) markets. On the other hand, a weakening AUD could possibly place more pressure on domestic commodity consumption given the increasing conversion costs (from USD to AUD) of imports (especially for the two largest – crude oil and petroleum). In terms of fixed-income investments, a rate spike could significantly hamper investors’ potential upside gains. In comparison to the US rising interest rate environment (where another two or three raises are expected to happen this year), Australia’s low-yielding but steady cash rate provides some capital protection for overseas investors, which should contribute to the domestic credit market gaining more popularity going forward. In addition, cheaper funding costs in Australia may attract more issuers and provide fixed-income investors with a larger pool to achieve better diversification. Market Commentary: ANZ Lowered TD Offerings The swap curve continued its upward trend over the last month with the 1M BBSW, 1Y swap and 3Y swap rising 0.06%, 0.01% and 0.05% respectively, despite a small drop of 0.01% in 6M BBSW. To us, this indicates outright higher funding costs for domestic banks but also some uncertain impact from the Royal Commission. With their broadly sound funding positions, domestic banks appear quite happy to maintain a conservative strategy for TDs in May 2018. The domestic TD market was quite placid over the month and specifically, CBA and WBC both left their TD offerings on hold at 2.00% (3M), 2.05% (6M) and 2.30% (12M) respectively. NAB in contrast reduced its medium-term TD rate by 0.25% to 2.05% but remains passive in adjusting rates for other terms. ANZ made a second 0.10% cut in TD offerings across all tenors, following the same move in the previous month (Figure 4). Figure 4. ANZ TD Offerings from June 2017 to May 2018
  Source: BondAdviser, Company Reports Although the Fed rate increased in March and two or three more hikes should occur over the rest of the year, this does not seem to trouble the RBA’s “hold” mentality at all. We view the key factors dragging on the cash rate in short term as including the underperforming CPI, high household debt level, easing but still restrictive housing markets and stagnant wage growth. Clearly, until the economy recovers over the medium or long term, the cash rate should remain locked at 1.50%. Comparing Term Deposit Rates As mentioned, ANZ made a 0.10% TD reduction across its offered tenors, further placing the bank in a more disadvantageous position compared to its major peers. However, it’s “Advance Notice Term Deposit” continues to provide comparable returns to its major peers, but does require 31 days’ notice prior to withdrawal. NAB decreased its medium-term offering by 0.25%, losing its most favourable market position and coming into line with CBA and WBC’s 2.05% offering in the same tenor. The long-term TD market is dominated by NAB’s 2.40% offerings, 0.10% ahead of CBA and WBC. The regional banks’ TDs continue to provide extra yield to the majors with BOQ remaining in a favourable position and offering some substantial premia. Term Deposit Rates
| May – 18 | Apr-18 | Change | ||
| Short Term (~1-4 Months) | ANZ | 1.35% | 1.45% | -0.10% |
| CBA | 2.00% | 2.00% | Unchanged | |
| NAB | 2.00% | 2.00% | Unchanged | |
| WBC | 2.00% | 2.00% | Unchanged | |
| BEN | 2.00% | 2.00% | Unchanged | |
| BOQ | 2.00% | 2.25% | -0.25% | |
| Medium Term (~6-8 Months) | ANZ | 1.50% | 1.60% | -0.10% |
| CBA | 2.05% | 2.05% | Unchanged | |
| NAB | 2.05% | 2.30% | -0.25% | |
| WBC | 2.05% | 2.05% | Unchanged | |
| BEN | 2.10% | 2.10% | Unchanged | |
| BOQ | 2.55% | 2.40% | 0.15% | |
| Long Term (~9-12 Months) | ANZ | 1.50% | 1.60% | -0.10% |
| CBA | 2.30% | 2.30% | Unchanged | |
| NAB | 2.40% | 2.40% | Unchanged | |
| WBC | 2.30% | 2.30% | Unchanged | |
| BEN | 2.30% | 2.30% | Unchanged | |
| BOQ | 2.70% | 2.70% | Unchanged |
Source: Company Data Chart Pack 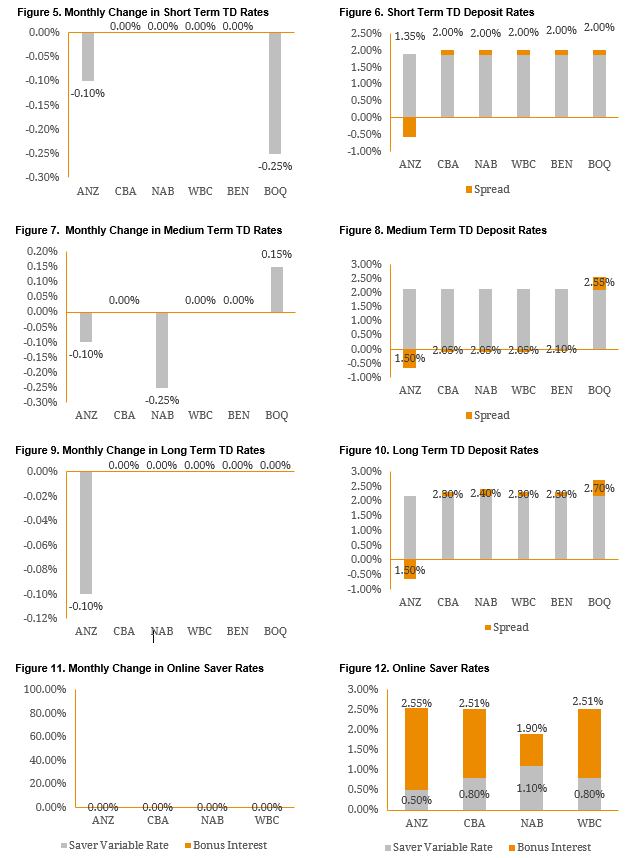 Source: BondAdviser, Company Reports *Note: Short Term refers to best Term Deposit rate under 1-4 months, Medium Term refers to best Term Deposit rate under 5-8 months and Long Term refers to best Term Deposit rate under 9-12 months. Click here for PDF Version Background on Term Deposits Deposits offer investors a range of benefits over other types of investments:
- The diverse offering in Australia allows for investment flexibility. Depositors are able to choose their investment term and deposit type. This allows the investors to effectively express their view on interest rates.
- Deposits offer certainty of returns. The type of deposit and level of base rate on the transaction date remains unchanged during the duration of the investment. This allows the investor to avoid market volatility.
- For amounts up to $250,000, deposits are currently guaranteed by the federal government. As a result, credit risk is minimal.
Key negatives to term deposits include:
- Interest Rate Risk – the risk that a TD purchased and subsequently locked in is lower than the future market interest rate on offer.
- Liquidity risk – TDs can only be liquidated early with the issuing institution (i.e. there is no open market) and will usually result in a reduction in the effective interest rate for the term. This typically involves 31 days’ notice.
- TDs offer no capital upside as seen in other fixed income products such as bonds and hybrids.
- Income from TDs is fully taxable at the investor’s marginal tax rate (i.e. no franking).