
Last week, global equity markets experienced a severe sell-off which originated for the US following better than expected wage inflation data. While this is generally an indication of a strengthening underlying economy, equity investors were spooked of the idea that the era of easy month (and hence the return of a free flowing economy) was coming to an end. As a result of this complacency and comfort, the CBOE Volatility Index (VIX) had progressively declined to pre-GFC lows and due to the historical positive skew of the volatility (Figure 2), an increasing risk environment occurred much faster than a declining risk environment. Specifically, the VIX finished market-close high of ~40 during the week but reached as high at ~51 intra-day. To put this in perspective, the closing value of the VIX has exceed 40 just 0.5% over the past 20 years. Figure 1. CBOE Volatility Index (VIX) – 20 Years 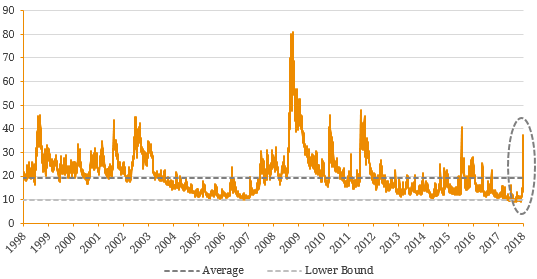 Source: BondAdviser, Bloomberg Figure 2. CBOE Volatility Index (VIX) – 20 Year Distribution
  Source: BondAdviser, Bloomberg If we consider the broad risk-asset spectrum, this was not a contagious risk event. A common forward-looking risk metric in the fixed income market is the credit spread (interchangeable with trading margin) which basically captures the future probability of default. Without going into technical detail, the probability of default also is connected to equity volatility given the market information contained in a company’s stock price and balance sheet can translate into an implied risk of default. This is the foundation of many structural credit models such as Moody’s KMV. Due to this theoretical link regarding expectations, credit spreads have exhibited a notable correlation to the VIX over time (Figure 3). Figure 3. US High Yield (HY) Credit Spreads versus CBOE Volatility Index (VIX)
  Source: BondAdviser, Bloomberg While US credit spreads widened in wake of the volatility spike, it was nowhere near the same magnitude as the increase in the VIX and consequential decline in major equity indices. This suggests the fixed income market was not convinced this was an inflection point in the current cycle. We concede a similar scenario occurred in 2015/16 where a spike occurred in the months preceding spread widening highlighting that we have been in this position before. However, over the long-term the relationship between a rising spread environment and looming recessions cannot be ignored withstanding a few false starts (Figure 4). Figure 4. Historical US Corporate Trading Margin vs US Recessionary Periods
  Source: BondAdviser, Moody’s Overall, a shift in the economic cycle is grounded by fundamentals. This is a difficult element to capture quantitatively on the forward-looking basis but given the VIX spike and hence, equities sell-off was arguably exasperated by volatility-related Exchange Traded-Funds, it is questionable whether the index is an accurate indicator of fundamentals. For this reason, we prefer the use of credit spreads and/or interest rate differentials in determining where we fit in the broader macroeconomic timeline which we have detailed in length in our publication, “First Half 2018 Outlook: Where to From Here?”.
An employee-owned financial services provider focused on the Debt Capital Markets.
© Bond Adviser Pty Ltd ‧ ASFL 456783 ‧ ABN 31 164 148 467 ‧ Important Information
This site is protected by reCAPTCHA and the Google Privacy Policy and Terms of Service apply.
© Bond Adviser Pty Ltd ‧ ASFL 456783
ABN 31 164 148 467 ‧ Important Information
This site is protected by reCAPTCHA and the Google Privacy Policy and Terms of Service apply.