
As we reach the middle of Q1 2019, with reporting season well underway and Commissioner Kenneth Hayne’s final report has been thus far absorbed by financial markets, it appears that credit fundamentals remain broadly intact. Now is a good chance to review the current conditions in credit markets and understand the risk and return characteristics of different areas of a company’s capital structure. Figure 1 below gives an idea of the current yield environment, from the “risk-free” RBA Cash Rate of 1.50% right through to the 9.87% dividend yield available to investors in the major banks. Figure 1. Domestic Comparable Yield Data (21 February 2019) 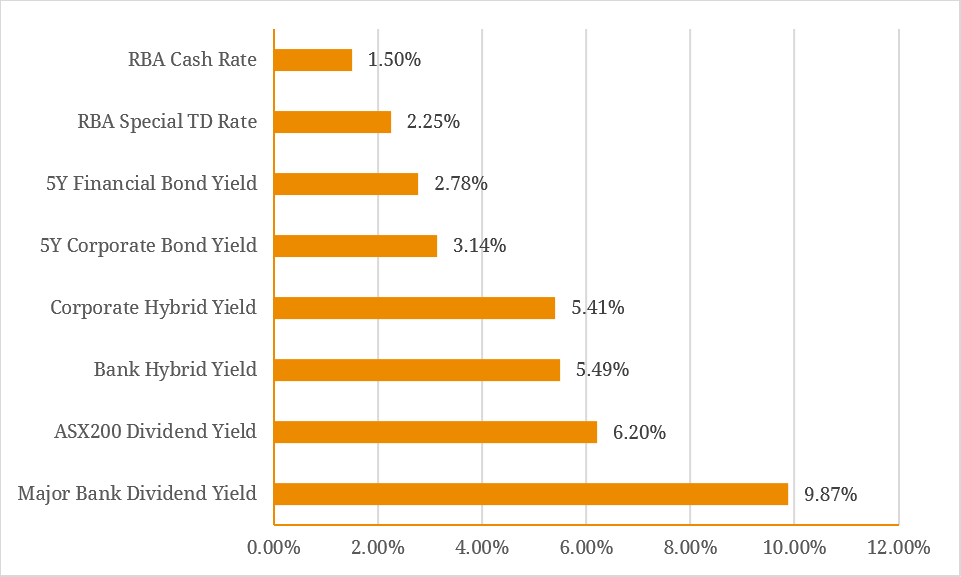 Source: BondAdviser, Bloomberg However, basic investment theory tells us that where there is return, there will also be risk. This was especially the case for equity investors in the major banks and AMP Limited (ASX: AMP) throughout the 2018 Financial Services Royal Commission, which saw shares tumble (figure 2). Figure 2. Big Four Bank and AMP Rebased Historical Share Prices (January 2018 – February 2019)
  Source: BondAdviser, Bloomberg AMP, in particular, was hit hard by continued revelations of long-term misconduct. Equity markets responded quite naturally, with AMP’s stock price plummeting 15.9% during the time of its appearance at the Commission, as investors appropriately priced in the possibility of future penalties and adverse consequences of the institution’s cultural and managerial failures. Although equities of well-established companies are usually considered relatively stable (particularly versus recently-listed companies), the swift market reactions to AMP’s debt and equity over the last 14 months highlight the sliding scale of capital stability we have traditionally seen across senior unsecured, tier 2 (subordinated), hybrid (additional tier 1) and equity instruments (figure 3). Figure 3. Rebased Capital Price Return on Selected AMP Instruments
  Source: BondAdviser, Bloomberg Given one of the foundations of income investing is capital preservation, AMP shares evidently did not fulfil this criterion, as well as equity holders, may have hoped in 2018. Although it can be easy to be drawn into the additional yield associated with equities seen in figure 1, this must be balanced against the capital volatility expected over the investment horizon. In contrast, the news was better for investors up the capital stack on a total return basis, as senior unsecured debt, the most senior-ranking in the capital structure of the four sample instruments, outperformed all others on a total return basis in 2018 (figure 4). Figure 4. Historical Total Returns on Selected AMP Instruments (January 2018 – February 2019)
  Source: BondAdviser, Bloomberg When analysing a hybrid’s return composition, in the same manner, we can see that capital volatility is substantially reduced. In normal conditions, return volatility remains broadly range bound but in a distressed scenario, the instrument follows a similar behaviour to AMP equity. Given Tier 1 hybrids sit above equity on the capital structure, this is an expected and reasonable response. Another consideration for both equity and fixed income investors is the return-volatility trade-off within returns. Figure 5 below shows that once again, it was the most senior ranking instrument (senior unsecured) that delivered the lowest daily return volatility from January 2018 through to February 2019. While yield is important (arguably the most important aspect of investing in equities) its benefits can be completely eroded without capital preservation. As an investor moves up the capital structure, capital volatility should decrease, and the stability of regular income streams becomes more easily obtained on a total return basis. Figure 5. 1-Year Daily Price Volatility for Selected AMP Instruments
  Source: BondAdviser, Bloomberg Investors should always be aware that both equities and fixed income are two-way games; higher yield will always mean higher risk in the yield/capital paradigm. Equity investors of AMP experienced a substantial dosage of this lesson over the past 14 months, with the potential for more on the horizon. This example serves as a reminder that for good reason equities are classified as a growth asset while traditional fixed income is perceived as more defensive. Further, the tendency for markets to overweight the significance of events like those seen over the past 14 months are exaggerated more so in equities markets, which are intrinsically more volatile.
An employee-owned financial services provider focused on the Debt Capital Markets.
© Bond Adviser Pty Ltd ‧ ASFL 456783 ‧ ABN 31 164 148 467 ‧ Important Information
This site is protected by reCAPTCHA and the Google Privacy Policy and Terms of Service apply.
© Bond Adviser Pty Ltd ‧ ASFL 456783
ABN 31 164 148 467 ‧ Important Information
This site is protected by reCAPTCHA and the Google Privacy Policy and Terms of Service apply.